
UNITED STATES
SECURITIES AND EXCHANGE COMMISSION
Washington, D.C. 20549
_______________________
FORM 10-K
(Mark One)
| ANNUAL REPORT PURSUANT TO SECTION 13 OR 15(d) OF THE SECURITIES EXCHANGE ACT OF 1934 | |||||
For the fiscal year ended December 31 , 2022
OR
| TRANSITION REPORT PURSUANT TO SECTION 13 OR 15(d) OF THE SECURITIES EXCHANGE ACT OF 1934 | |||||
For the transition period from ______________ to ______________
Commission File Number: 1-36254
_______________________
(Exact Name of Registrant as Specified in Its Charter)
| (State or Other Jurisdiction of Incorporation or Organization) | (I.R.S. Employer Identification No.) | |||||||||||||
| (Address of Principal Executive Offices, Including Zip Code) | ||||||||||||||
(978 ) 640-6789
(Registrant’s Telephone Number, Including Area Code)
Securities Registered Pursuant to Section 12(b) of the Act:
| Title of Each Class | Trading Symbol(s) | Name of each exchange on which registered | ||||||||||||||||||
Securities Registered Pursuant to Section 12(g) of the Act: None
_______________________
Indicate by check mark if the registrant is a well-known seasoned issuer, as defined in Rule 405 of the Securities Act. Yes x No ¨
Indicate by check mark if the registrant is not required to file reports pursuant to Section 13 or Section 15(d) of the Act. Yes ¨ No x
Indicate by check mark whether the registrant: (1) has filed all reports required to be filed by Section 13 or 15(d) of the Securities Exchange Act of 1934 during the preceding 12 months (or for such shorter period that the registrant was required to file such reports) and (2) has been subject to such filing requirements for the past 90 days. Yes x No ¨
Indicate by check mark whether the registrant has submitted electronically every Interactive Data File required to be submitted pursuant to Rule 405 of Regulation S-T (§232.405 of this chapter) during the preceding 12 months (or for such shorter period that the registrant was required to submit such files).
Indicate by check mark whether the registrant is a large accelerated filer, an accelerated filer, a non-accelerated filer, an emerging growth company or a smaller reporting company. See the definitions of “large accelerated filer,” “accelerated filer”, “emerging growth company” and “smaller reporting company” in Rule 12b-2 of the Exchange Act.
x | Accelerated Filer | ☐ | |||||||||
| Non-accelerated Filer | o | Smaller Reporting Company | |||||||||
| Emerging Growth Company | |||||||||||
If an emerging growth company, indicate by check mark if the registrant has elected not to use the extended transition period for complying with any new or revised financial accounting standards provided pursuant to Section 13(a) of the Exchange Act. ☐
Indicate by check mark whether the registrant has filed a report on and attestation to its management’s assessment of the effectiveness of its internal control over financial reporting under Section 404(b) of the Sarbanes-Oxley Act (15 U.S.C. 7262(b)) by the registered public accounting firm that prepared or issued its audit report. Yes x
If securities are registered pursuant to Section 12(b) of the Act, indicate by check mark whether the financial statements of the registrant included in the filing
reflect the correction of an error to previously issued financial statements. Yes☐ No x
Indicate by check mark whether any of those error corrections are restatements that required a recovery analysis of incentive-based compensation received by
any of the registrant’s executive officers during the relevant recovery period pursuant to §240.10D-1(b). Yes☐ No x
Indicate by check mark whether the registrant is a shell company (as defined in Rule 12b-2 of the Exchange Act). Yes ☐ No x
The aggregate market value of the voting stock held by non-affiliates of the registrant was approximately $1,078,422,056 based on the closing price of the Common Stock on the Nasdaq Global Select Market on June 30, 2022. The number of shares outstanding of the registrant’s Common Stock as of February 24, 2023 was 43,777,450 .
DOCUMENTS INCORPORATED BY REFERENCE | ||||||||||||||
| Document Description | 10-K Part | |||||||||||||
| Portions of the Registrant’s Proxy Statement for the 2023 Annual Meeting of Stockholders | III | |||||||||||||
AVID TECHNOLOGY, INC.
FORM 10-K
FOR THE FISCAL YEAR ENDED DECEMBER 31, 2022
TABLE OF CONTENTS
| Page | ||||||||
| Disclosure Regarding Foreign Jurisdictions that Prevent Inspections | ||||||||
ii
CAUTIONARY NOTE ON FORWARD-LOOKING STATEMENTS
This Annual Report on Form 10-K, or Form 10-K, filed by Avid Technology, Inc. together with its consolidated subsidiaries, “Avid” or the “Company”, or “we”, “us,” or “our” unless the context indicates otherwise, includes forward-looking statements within the meaning of the Private Securities Litigation Reform Act of 1995. For this purpose, any statements contained in this Form 10-K that relate to future results or events are forward-looking statements. Forward-looking statements may be identified by use of forward-looking words, such as “anticipate,” “believe,” “confidence,” “could,” “estimate,” “expect,” “feel,” “intend,” “may,” “plan,” “should,” “seek,” “will,” and “would,” or similar expressions.
Forward-looking statements may involve subjects relating to, among others, the following:
•the effect of the continuing worldwide macroeconomic uncertainty and its impacts, including inflation, market volatility and fluctuations in foreign currency exchange and interest rates on our business and results of operations, including impacts related to acts of war, armed conflict, and cyber conflict, such as, for example the Russian invasion of Ukraine, and related international sanctions and reprisals;
•the effects that the COVID-19 pandemic, including variants, and its related consequences may have on the national and global economy and on our business and operations, revenues, cash flows and profitability, and capital resources;
•our ability to successfully implement our strategy, including our cost saving measures and other actions implemented in response to market volatility and other adverse economic and commercial conditions;
•the anticipated trends and developments in our markets and the success of our products in these markets;
•our ability to develop, market, and sell new products and services;
•our business strategies and market positioning;
•our ability to expand our market positions;
•our ability to grow of our cloud-enabled platform;
•anticipated trends relating to our sales, financial condition or results of operations, including our ongoing shift to a recurring revenue model and complex enterprise sales with long sales cycles;
•the expected timing of recognition of revenue backlog as revenue, and the timing of recognition of revenues from subscription offerings;
•our ability to mitigate and remediate effectively the material weakness in our internal control over financial reporting, and the expected timing thereof
•our ability to successfully consummate acquisitions and investment transactions and to successfully integrate acquired businesses;
•the anticipated performance of our products;
•our ability to maintain adequate supplies of products and components, including through sole-source supply arrangements;
•our plans regarding repatriation of foreign earnings;
•the outcome, impact, costs, and expenses of pending litigation or any new litigation or government inquiries to which we may become subject;
•our compliance with covenants contained in the agreements governing our indebtedness;
•our ability to service our debt and meet the obligations thereunder;
•the effect of seasonal changes in demand for our products and services;
•estimated asset and liability values;
•our ability to protect and enforce our intellectual property rights; and
iii
•the expected availability of cash to fund our business and our ability to maintain adequate liquidity and capital resources, generally and in the wake of the COVID-19 pandemic and the continuing worldwide macroeconomic uncertainty described above.
Actual results and events in future periods may differ materially from those expressed or implied by the forward-looking statements in this Form 10-K. There are a number of factors that could cause actual events or results to differ materially from those indicated or implied by forward-looking statements, many of which are beyond our control, including the risk factors discussed in Item 1A of this Form 10-K. The forward-looking statements contained in this Form 10-K represent our estimates only as of the date of this filing and should not be relied upon as representing our estimates as of any subsequent date. While we may elect to update these forward-looking statements in the future, we specifically disclaim any obligation to do so, whether to reflect actual results, changes in assumptions, changes in other factors affecting such forward-looking statements, or otherwise.
The information included under the heading “Stock Performance Graph” in Item 5 of this Form 10-K is “furnished” and not “filed” and shall not be deemed to be “soliciting material” or subject to Regulation 14A, shall not be deemed “filed” for purposes of Section 18 of the Securities Exchange Act of 1934, or the Exchange Act, or otherwise subject to the liabilities of that section, nor shall it be deemed incorporated by reference in any filing under the Exchange Act or the Securities Act of 1933, or the Securities Act, except to the extent that we specifically incorporate it by reference.
We own or have rights to trademarks and service marks that we use in connection with the operation of our business. “Avid” is a trademark of Avid Technology, Inc. Other trademarks, logos, and slogans registered or used by us and our subsidiaries in the United States and other countries include, but are not limited to, the following: Avid, Avid NEXIS, AirSpeed, FastServe, MediaCentral, Media Composer, Pro Tools, and Sibelius. Other trademarks appearing in this Form 10-K are the property of their respective owners.
iv
PART I
1
ITEM 1.BUSINESS
OVERVIEW
We develop, market, sell, and support software and integrated solutions for video and audio content creation, management, and distribution. We are a leading technology provider that powers the media and entertainment industry. We do this by providing an open and efficient platform for digital media, along with a comprehensive set of creative software tools and workflow solutions. Our solutions are used in production and post-production facilities; film studios; network, affiliate, independent and cable television stations; recording studios; live-sound performance venues; advertising agencies; government and educational institutions; corporate communications departments; and by independent video and audio creative professionals, as well as aspiring professionals. Projects produced using our tools, platform, and ecosystem include feature films, television programming, live events, news broadcasts, sports productions, commercials, music, video, and other digital media content. With over one million creative users and thousands of enterprise clients relying on our technology platforms and solutions around the world, Avid enables the industry to thrive in today’s connected media and entertainment world.
Our mission is to empower media creators with innovative technology and collaborative tools to entertain, inform, educate, and enlighten the world. Our clients rely on Avid to create prestigious and award-winning feature films, music recordings, television shows, live concerts, sporting events, and news broadcasts. Avid has been honored for technological innovation with 18 Emmy Awards, one Grammy Award, two Oscars (Scientific and Technical Academy Awards of Merit), and the first ever America Cinema Editors Technical Excellence Award.
For a discussion around the macroeconomic conditions and their impacts on our business, see "Management's Discussion and Analysis of Financial Condition and Results of Operations - Executive Overview" in Item 7 of this Form 10-K.
Avid was incorporated in Delaware in 1987. We are headquartered in Burlington, Massachusetts, with operations in North America, South America, Europe, the Middle East, Asia and Australia.
CORPORATE STRATEGY
The rate of content creation and the acceleration of digitization are having a tremendous impact on the media industry and altering the industry value chain. Today’s consumers are empowered to create and consume content on-demand, anywhere, anytime. Organizations in the media industry are under pressure to connect and automate the entire creation-to-consumption workflow, and are facing a number of challenges, including:
•Increasing rate of content creation and digitization of media assets - Many organizations are feeling intense pressure to create more and more content, increasingly tailored for audience niches, while also facing greater competition from nimble players. At the same time, access to creative software tools is wider today than ever before, giving more people the ability to tell their stories.
•Exponential growth of distribution platforms - The number of distribution platforms continues to expand, and the economic models of new distribution platforms are still evolving. To satisfy their customers, organizations need to develop or license content for their distribution platforms. Many organizations need to embrace new opportunities while also maximizing heritage business.
•Continued increase in content consumption - There has been a tremendous increase in viewership in the last decade, but it is spread across many outlets and channels. This increase in viewership is dwarfed by an increase in competitive content. In addition, with growing audience fragmentation, compelling content, brand equity, and relevance are critical.
•Disparate mix of tools, skills, and workflows - Lack of commonality and a fragmented supplier landscape creates incompatibilities, inhibiting of tools, which inhibits agility, collaboration, sharing, and efficiency.
2
•Media technology budgets - Today’s economic realities are placing pressure on media technology budgets, while media companies feel increased pressure to expand content output to deliver on the market requirements. Many content creators and distributors have to work with essentially flat budgets, which demands more efficient workflows and solutions.
We believe we are well positioned in the media technology industry because we have a set of differentiated creative software tools (including ProTools for audio and Media Composer for video), a differentiated platform strategy (Avid MediaCentral platform described below) and a well-established market position. Our products and solutions allow our customers to (i) create high-quality, engaging, and immersive content, (ii) distribute to more outlets and devices, (iii) maximize and protect the value of media assets, and (iv) create operational and capital efficiency. As a result of our market position across the media industry, we believe we can take advantage of the following opportunities and trends:
•Large and growing market poised for transition - Our customers are facing significant disruption and need to make major changes and investments in their business and operational approaches to address the challenges described above. Our product offerings help them address those challenges.
•Deeply entrenched with a market leadership position - We can strategically leverage a significant global customer base that is loyal to our brand across TV, film, music, and media.
•Positioned to help the industry navigate disruption - Our unique approach encompasses a common technology platform, leading software applications and integrated solutions with a large and open ecosystem, which we believe differentiates us from many of our competitors.
•Ready to intercept the next emerging opportunity - By leveraging our partnership with Microsoft and our MediaCentral platform, we believe we can lead the media and entertainment industry into the cloud with market-leading Software as a Service, or SAAS, offerings.
Our strategy for connecting creative professionals and media enterprises with audiences in a powerful, efficient, collaborative, and profitable way leverages our creative software tools, including Pro Tools for audio and Media Composer for video, and our MediaCentral Platform - the open, extensible, and customizable foundation that streamlines and simplifies content workflows by integrating all Avid or third-party products and services that run on top of it. The platform provides secure and protected access, and enables fast and easy creation, delivery, and monetization of content.
A key element of our strategy is our transition to a recurring revenue-based model through a combination of subscription offerings, maintenance contracts, and long-term agreements. We started offering subscription licensing options for some of our products and solutions in 2014 and by the end of 2022 we offered subscription licensing for all of our software solutions and we had approximately 506,000 paid subscriptions. Subscription count includes all paid and active seats under multi-seat licenses. These licensing options offer choices in pricing and deployment to suit our customers’ needs. We expect to increase subscription sales to media enterprises going forward as we expand offerings and move through customer upgrade cycles, which we expect will further increase recurring revenue on a longer-term basis. Our long-term agreements are comprised of multi-year agreements with large media enterprise customers to provide specified products and services, including SAAS offerings, and agreements with channel partners and resellers to purchase minimum amounts of products and service over a specified period of time.
Avid is committed to our digital transformation initiative, which focuses on optimizing systems, processes, and back-office functions with the objective of improving our operations related to our digital and subscription business. The initiative started in the third quarter of 2021, and is expected to continue through 2024. We plan to significantly invest in transforming our enterprise-wide infrastructure and technologies to benefit customers and drive enhanced performance across the company.
CUSTOMER MARKETS
We provide our solutions to the following markets:
3
•Media Enterprises. This market consists of broadcast, government, sports, and other organizations that acquire, create, process, and/or distribute audio and video content to a large audience for communication, entertainment, analysis, and/or forensic purposes. Customers in this market rely on workflows that span content acquisition, creation, editing, distribution, sales, and redistribution and utilize all content distribution platforms, including web, mobile, internet protocol television, cable, satellite, on-air, and various other proprietary platforms. Our expertise also allows us to provide customers in this market with a range of professional and learning services. We sell into this market through our direct sales force and resellers.
•Creative Professionals. This market is made up of individual artists and small entities that create audio and video media as a paid service but do not currently distribute media to end consumers on a large scale. This market spans a wide-ranging target audience that includes: independent video editors; facilities and filmmakers that produce video media as a business but are not broadcasters; professional sound designers, editors, and mixers and facilities that specialize in the creation of audio for picture; songwriters, musicians, producers, film composers, and engineers who compose and record music professionally; technicians, engineers, rental companies, and facilities that present, record, and broadcast audio and video for live performances; and students and teachers in career technical education programs in high schools, colleges, universities, and post-secondary vocational schools that prepare students for professional media production careers in the digital workplace. Our expertise also allows us to provide customers in this market with a broad range of professional services. We sell into this market through our webstore, resellers (including storefront and online retailers) and our direct sales force.
PRODUCTS AND SERVICES
Overview
Avid’s growing product portfolio provides open and extensible products that help secure our long-term position with customers. Our software and integrated solutions, as well as our services offerings, address the diverse needs, skills, and sophistication levels of our customers. In addition, we provide flexible deployment models, licensing options, and commercial structures so our customers can choose how, when, and where to deploy and use our tools.
Approximately half of our revenue comes from the high margin standalone software portion of our product portfolio, consisting of subscriptions, maintenance contracts and perpetual licenses for our Creative Software Solutions and our Enterprise Software Solutions.
Creative Software Solutions
Our Creative Software Solutions includes our Media Composer, Pro Tools, and Sibelius tools, as well as Avid Link, all of which are key components of our cloud-enabled software subscription strategy.
Media Composer
Our award-winning Media Composer product line is used to edit video content, including television programming, commercials, and films. Our cloud-enabled solutions that include Media Composer enable broadcast news, sports, reality television, and film professionals to acquire, access, edit, and finish stories anytime and from everywhere. Leveraging an integrated, yet open, end-to-end architecture, this solution gives contributors the ability to craft stories where and while they are happening and speed them to delivery, while maintaining connectivity with the central production operation. Media Composer also offers resolution flexibility and independence, accelerating high-res, high dynamic range (HDR), and 4K resolution workflows. We offer Media Composer through both subscription and perpetual license offerings.
Pro Tools
Our Pro Tools digital audio workstation software facilitates the audio production process, including music and sound creation for TV and Film, recording, editing, signal processing, integrated surround mixing, and mastering with reference video playback. The Pro Tools platform supports a wide variety of internally developed and third-party software plug-ins and
4
integrated hardware. Pro Tools solutions are offered at a range of price points and are used by professionals in music, film, television, radio, gaming, internet, and other media production environments. We offer Pro Tools software through both subscription and perpetual license offerings when included with our hardware.
Sibelius
Our Sibelius product allows users to create, edit, and publish musical scores. It is used by composers, arrangers, and other music professionals and for music education. Sibelius music notation software offers sophisticated, yet easy-to-use tools across desktop and mobile devices that are proven and trusted by composers, arrangers, publishers, educators, and students alike. We also offer Sibelius Cloud Sharing, which allows users to view and play scores anywhere from the cloud through a web browser and on mobile devices. We offer Sibelius through both subscription and perpetual license offerings with education discounts available to make it accessible to the teaching of music composition and score writing.
Avid Link
Avid Link is a free desktop and mobile application that offers a creative community a variety of benefits and value. It’s for anyone wanting to find, network, connect and engage in collaboration with other artists, producers, mixers, composers, editors, videographers, movie makers, and graphic designers, as well as explore the Avid Marketplace populated with third party applications and services to use within their workflow. Through Avid Link, users can subscribe to Avid Play and distribute their music to streaming services worldwide like Apple Music, Spotify, and TIDAL. Available for macOS, Windows, iOS, and Android OS users, Avid Link is intended to make it easy for users to find, connect, message, and collaborate with audio and video creators, promote their work and skills to a network of media professionals, manage and keep their software up to date, and purchase new tools. We believe Avid Link will increase interest and demand for Avid’s suite of product offerings.
Enterprise Software Solutions
Avid’s Enterprise Software Solutions are built on the MediaCentral platform along with a suite of applications, modules, and services and is also the foundation of our cloud and SAAS offerings.
MediaCentral
MediaCentral | Cloud UX is Avid’s next-generation media production suite that further extends the Avid MediaCentral platform into the cloud. The MediaCentral platform scales from the simplest to the most sophisticated solutions. Built on a customizable cloud native microservices architecture, MediaCentral platform features a cloud-based user experience that runs on any device, as well as workflow modules for editorial, production, news, graphics, and asset management. It also features applications to enhance and scale any of those modules, and a wide array of media services and partner connectors. Every user is connected in a completely integrated workflow environment with a user-friendly interface, and gains a unified view into all their media with flexible deployment options for on premises, hybrid, or cloud (public/private) environments.
As part of the Avid MediaCentral platform, we also offer Avid NEXIS | EDGE, (formally known as Editorial Management) a module for smaller creative teams that provides the same robust media management capabilities used by the largest media enterprises in the industry. Integrated within Media Composer via a panel, NEXIS | EDGE connects directly to Avid NEXIS storage to provide easy access to media with hyper-search functionality. Avid NEXIS | EDGE also extends collaboration capabilities for the assistant editor in an easy-to-use web interface by allowing Media Composer bin creation, logging, and search capabilities, greatly expanding the efficiency of creative teams.
SAAS Solutions
Avid | Edit On Demand, our first enterprise SaaS offering, provides a full SaaS-based virtual post-production environment in the cloud – complete with cloud-optimized Media Composer and Avid NEXIS storage.
We have a strategic partnership with Microsoft to deliver Azure-certified solutions to support end-to-end hybrid and cloud deployments of media production and news workflows. Our partnership includes developing virtualized versions of many of our product offerings, allowing them to run in a private cloud, public cloud, or in hybrid deployments. This enables customers to migrate to more traditional IT infrastructures leveraging IP technology to integrate disparate systems within a
5
post production and broadcast environment. We believe our new SAAS and cloud offerings allow our customers to (i) achieve the flexibility they require to keep up with the constantly rising demand for media production, ii) scale based on business needs to lower costs, (iii) enable anytime access, boosting efficiency and collaboration, and (iv) deliver content quickly and securely to any device, from anywhere. Our first enterprise SAAS offering, Edit on Demand, has been deployed in post production and news environments.
Integrated Solutions
The Integrated Solutions part of our portfolio mainly consists of four common, best-in-class hardware platforms that are combined with tightly integrated software elements to create powerful and differentiated solutions, all of which complement and enhance our overall software strategy.
Avid NEXIS
Our Avid NEXIS family of shared storage systems are real-time, open solutions that bring the power of shared storage to local, regional, national and multinational broadcasters, and post-production facilities at competitive prices. Customers can improve allocation of creative resources and support changing project needs with an open, shared storage platform that includes file system technology on lower cost hardware, support for third-party applications, and streamlined administration to create more content at an affordable price. Avid NEXIS is the industry’s first and only software-defined storage platform specifically designed for storing and managing media. Avid NEXIS enables fully virtualized storage so media organizations can adjust storage capacity mid-project, without disrupting workflows. Powered by our MediaCentral Platform, Avid NEXIS delivers media storage flexibility, scalability, and control for both Avid-based and third-party workflows. It has been designed to serve small production teams as powerfully as large media enterprises and is built with flexibility to grow with customers through their business stages. In addition to on-premises Avid NEXIS workflows, Avid NEXIS Cloud provides on-line, nearline and archive storage tiers in the cloud, and is a key component of our SAAS offerings. Beginning in 2022, we started offering NEXIS | Flex storage management software as a subscription, separately from the underlying Avid NEXIS storage system or Avid NEXIS Cloud storage.
Avid S4 and S6
Our Avid S4 and S6 product line offers customers a range of large format control surfaces for sound recording and mixing, leveraging Avid’s widely supported EUCON control protocol to provide cross platform DAW mixing solutions for customers ranging from the independent professional to the TV and Feature Film enterprises. The Avid S4 and S6 was designed as a modular solution that scales to meet both current and future customer requirements. It was designed for audio professionals in demanding production environments, delivering the performance needed to complete projects faster while producing high quality mixes.
Avid S1 and Dock
The Avid Dock and Avid S1 audio control surfaces satisfy both enthusiasts and professional mixing workflows in small to mid-sized studios and sound design suites. Avid S1 and Dock are compact EUCON enabled controllers, yet modular to expand to larger configurations fulfilling more budget-conscious and space constrained applications in music and audio post facilities. The Avid S1 and Dock fitted with ipad or android tablets deliver the speed, rich visual feedback, and software integration of Avid’s high-end consoles in a portable, slimline surface that’s an easy fit for any space or budget.
VENUE | S6L Live Sound
Our VENUE product family and our VENUE | S6L live sound system includes console systems for mixing audio for live sound reinforcement for concerts, theater performances, and other public address events. We offer a range of VENUE systems designed for large performance settings, such as stadium concerts, as well as medium-sized theaters and houses of worship. VENUE systems allow the direct integration of Pro Tools solutions to play back tracks and record live productions of any size and allow the same processing plug-ins used during the album creation to be used for the artists live performances.
Maestro
6
Our Maestro product line offers customers comprehensive production graphics solutions, ideal for any type of production needs in news, sports, and entertainment, creating greater accessibility, efficiency at scale to enable the delivery of content with graphics faster. Maestro features a core platform that includes a powerful render engine and featured design tool called Maestro | Designer that drives a line-up of applications that are designed to address the specific challenges broadcasters face when automating the integration of statistics and graphics for the creation of an engaging broadcast. By tightly integrating Maestro with MediaCentral we enable journalists and producers to add graphics remotely to news stories or enhance any story with innovative stats to drive augmented reality graphics for presenting data in new and compelling ways. Beginning in 2022, we started offering our Maestro solutions as a subscription that can run on general purpose servers and graphics cards.
FastServe
Our FastServe video server product line assists broadcasters in making the move to UHD and IP based workflows with a new, modular architecture. The Avid FastServe family integrates with the MediaCentral platform, empowering creative teams to deliver content fast for news, sports, entertainment, and other media productions. Its 10GbE interface offers direct connection to Avid NEXIS storage, enabling real-time ingest, editing, and playout, even while media is being captured. Its modular architecture improves efficiency and provides a smooth transition from HD to UHD, and from SDI workflows to video over IP. We also continue to sell and support our on-air server solutions, including AirSpeed 5000 and AirSpeed 5500, which enable broadcasters to automate the ingest and playout of television and news programming. The AirSpeed 5000 and 5500 video servers work with a wide range of applications to improve workflow and provide cost-efficient ingest and play to air capabilities for broadcasters of any size.
I/O and Processing
We offer a number of hardware products that complement our Media Composer and Pro Tools creative solutions, which include I/O devices, interfaces, and audio and video processing equipment. We have recently updated our Pro Tools Hardware portfolio with new offerings including, Pro Tools| Carbon Pre and MBOX Studio providing a lower cost audio interface solution for enthusiasts and professional content creators.
Maintenance
We offer a variety of maintenance contracts for our software and integrated solutions, allowing each customer to select the level of technical and operational support that they need to maintain their operational effectiveness. Maintenance contracts typically include the right to the latest software updates, call support, and, in some cases, hardware maintenance. Maintenance contracts for individual products are sold bundled with initial product offerings or as renewals once initial contracts have lapsed. Maintenance contracts are also sold on an enterprise basis where a customer purchases maintenance for all Avid products owned. Our Customer Care team provides customers with a partner committed to giving them help and support when they need it. Our global Customer Care team of industry professionals offers a blend of technology expertise and real-world experience throughout the audio, visual, and entertainment industries. The team’s mission is to provide timely, informed responses to our customers’ issues and proactive maintenance for our solutions to help our customers maintain high standards of operational effectiveness.
Professional Services
Our Professional Services team delivers workflow design and consulting, program, and project management, system installation and commissioning, custom development, and role-based product level training. The Professional Services team facilitates the engagement with our customers to maximize their investment in technology, increase their operational efficiency, and enable them to reduce deployment risk and implement our solutions.
Learning Services
Our Learning Services team delivers public and private training classes as well as self-paced eLearning content to our customers and alliance partners to ensure that they have the necessary skills and technical competencies to deploy, use, administer, and create Avid solutions. The Learning Services team develops and licenses curriculum content for use by third-party Avid Learning partners to deliver training to customers, users, and alliance partners. The Learning Services team
7
includes the Avid Certification program which validates the skills and competency of Avid users, administrators, instructors, support representatives, and developers.
COMPETITION
The markets in which we serve our customers are highly competitive and subject to rapid change. The competitive landscape is fragmented with a large number of companies providing various types of products and services in different markets and geographic areas. We provide integrated solutions that compete based on total workflow value, features, quality, service, and flexibility of pricing and deployment options. Companies with which we compete in some contexts may also act as our partners in other contexts, such as large enterprise customer environments.
Certain companies that compete with us across some of our products and solutions are listed below by the market relevant to Avid in which they compete predominantly:
•Broadcast and Media: ChyronHego Corporation, Dalet S.A., Dell Technologies Inc. (EMC Isilon), EVS Corporation, Grass Valley, Harmonic Inc., Quantum Corporation, Ross Video Limited, and Vizrt Ltd., among others.
•Audio and Video Post and Professional: Ableton AG, Adobe Systems Incorporated, Apple Inc., AudioTonix Limited, Blackmagic Design Pty Ltd, PreSonus Audio Electronics, Inc., and Yamaha Corporation, among others.
For additional information about risks associated with our competitors, see “Risk Factors” in Item 1A of this Form 10-K.
OPERATIONS
Sales and Services Channels
We market and sell our products and solutions through a combination of direct, indirect, and digital sales channels. Our direct sales channel consists of internal sales representatives serving select customers and markets. Our indirect sales channels include global networks of independent distributors, value-added resellers, system integrators, and retailers. Our digital sales channel is represented by the online Avid Marketplace. We also sell digitally through the Xchange Market Platform, or XMP, with some of our key partners and distributors.
We have significant international operations with offices in 17 countries and the ability to reach customers in approximately 173 countries through a combination of our direct sales force and resellers. Sales to customers outside the United States accounted for 57%, 58% and 60% of our total net revenues in 2022, 2021 and 2020, respectively. Additional information about the geographic breakdown of our revenues can be found in Note P to our Consolidated Financial Statements in Item 8 of this Form 10-K. For additional information about risks associated with our international operations, see “Risk Factors - Risks Related to our International Operations” in Item 1A of this Form 10-K.
We generally ship our products shortly after the receipt of an order. However, a high percentage of our revenues has historically been generated in the third month of each fiscal quarter and concentrated in the latter part of that month. Orders that may exist at the end of a quarter and have not been shipped are not recognized as revenues in that quarter and are included in revenue backlog.
We provide customer care services directly through regional in-house and contracted support centers and major-market field service representatives. We also provide customer care services indirectly through dealers, value-added resellers, and authorized third-party service providers. Depending on the solution, customers may choose from a variety of support offerings, including telephone and online technical support, on-site assistance, hardware replacement and extended warranty, and software upgrades. In addition to customer care services, we offer a broad array of professional services, including installation, integration, planning and consulting services, and customer training.
8
Manufacturing and Suppliers
Our manufacturing operations consist primarily of a network of contract manufacturers around the globe to manufacture many of our products, components and subassemblies, and original equipment manufacturers, or OEMs, from whom we purchase finished assemblies. Our products undergo testing and quality assurance at the final assembly stage. We depend on sole-source suppliers for many key hardware product components and finished goods, including some critical items.
Our contract manufacturers and OEMs manufacture our products at a relatively limited number of facilities located throughout the world and, in most cases, the manufacturing of each of our products is concentrated in one or a few locations. For additional information about risks associated with our sole source suppliers and manufacturing operations, see “Risk Factors” in Item 1A of this Form 10-K.
Research and Development
We are committed to delivering best-in-class digital media content-creation solutions that are designed for the unique needs, skills and sophistication levels of our target customer markets as well as a standardized media platform for the media industry. We have research and development, or R&D, operations in six facilities located in five countries. Our R&D efforts are focused on the development of digital media content-creation, distribution, and monetization tools as well as the media platform. These tools operate primarily on the Mac and on Windows platforms, whereas the media platform primarily operates on Linux platforms. Our R&D efforts also include highly optimized media storage solutions, standards-based media transfer and media asset management tools, and ingest and playout solutions to cover the entire workflow. Our R&D expenditures for 2022, 2021 and 2020 were $66.9 million, $65.6 million and $57.0 million, respectively, which represented 16% of our total net revenues in each year.
We prioritize research and development investments to take advantage of market opportunities based on the following short-term, medium-term, and long-term horizons:
•Here & Now - Improve performance, solidify core portfolio, improve margins, and ignite growth.
•Emerging - Expand opportunities by pursuing growth areas, extending our product portfolio, and expanding market opportunities.
•Transformational - Build for the future, creating unique defensible differentiation in our products and solutions with disruptive and visionary innovation.
Our company-operated R&D operations are located in: Burlington, Massachusetts; Berkeley, California; London, United Kingdom; Madrid, Spain; Munich, Germany; Kfar Saba, Israel; Szczecin, Poland; and Montreal, Canada. We also partner with a vendor in Kiev, Ukraine for outsourced R&D services, which vendor has relocated as a result of the Russian invasion of Ukraine. For additional information about risks associated with our R&D efforts, see “Risk Factors - Risks Related to Intellectual Property” in Item 1A of this Form 10-K.
Intellectual Property
We regard our software and hardware as proprietary and protect our proprietary interests under the laws of patents, copyrights, trademarks, and trade secrets, as well as through contractual provisions.
We have obtained patents and have registered copyrights, trademarks and service marks in the United States and in many foreign countries. At January 23, 2023, we held 112 U.S. patents, with expiration dates through 2041, and had 14 patent applications pending with the U.S. Patent and Trademark Office. We have also registered or applied to register various trademarks and service marks in the United States and a number of foreign countries, including Avid, Avid NEXIS, AirSpeed, FastServe, MediaCentral, Media Composer, Pro Tools, and Sibelius. As a technology company, we regard our patents, copyrights, trademarks, service marks, and trade secrets as being among our most valuable assets, together with the innovative skills, technical competence, and marketing abilities of our personnel.
Our software is licensed to end users pursuant to shrink-wrap, embedded, click-through, or signed license agreements. Our products generally contain features to guard against unauthorized use. Policing unauthorized use of computer software is difficult, and software piracy is a persistent problem for us, as it is for the software industry in general. For additional
9
information about risks associated with the protection of our intellectual property, see “Risk Factors” in Item 1A of this Form 10-K.
HUMAN CAPITAL
We are intentional about creating an environment where our employees can thrive and feel included, empowered, and passionate about our products and customers. As of December 31, 2022, we had approximately 1,485 full-time employees and 395 external contractors located globally in 34 countries. Of these, 37% were located in the United States, Canada, and Latin America, 43% in Europe, Middle East, and Africa, and 20% in Asia-Pacific.
As we have emerged from the COVID-19 pandemic, we have returned to our new normal, stronger than ever. In 2022, we worked to compete and differentiate in a highly competitive talent market by focusing on our employer brand and unique culture. We welcomed 272 new employees, of varying backgrounds, around the world representing all types of diversity. We have evolved our Work from Anywhere policy to embrace a combination of hybrid and remote workers. This allows our employees around the globe to gather in our key offices in order to build and enhance personal connections, improve communication, foster collaboration, and ensure the contributions of all employees across our teams. We have further adopted our TeamAvid Community, so we can virtually share communications, collaborate, and engage with each other from anywhere across our business.
We believe that there is power in each individual to enhance opportunities through experiences that help them grow and develop in their career. Our managers hold quarterly check ins with each member of their team to discuss performance, the business, and future career interests. We have expanded beyond our Avid University platform, to provide additional opportunities to learn about our business, products, customers, and keys to success.
We believe our company culture is a differentiator for us, and critical to our success. We bring our values to life by articulating what they look like in practice and recognizing people and teams that exemplify them. They serve as an anchor during times of uncertainty and challenge. We have employed an employee listening strategy to understand the sentiment of our people across the employee lifecycle. We have moved from an annual eNPS survey to a more frequent cadence and work with our leaders to use this feedback to help keep our employees enthusiastic about Avid, and passionate about being on a winning team.
AVAILABLE INFORMATION
We make available free of charge on our website, www.avid.com, copies of our Annual Reports on Form 10-K, our Quarterly Reports on Form 10-Q, our Current Reports on Form 8-K, and all amendments to those reports as soon as practicable after filing with the Securities and Exchange Commission, or SEC. Additionally, we will provide paper copies of all of these filings free of charge upon request. Alternatively, these reports can be accessed at the SEC’s Internet website at www.sec.gov. The information contained on our web site shall not be deemed incorporated by reference in any filing under the Exchange Act.
10
ITEM 1A.RISK FACTORS
You should carefully consider the risks and uncertainties described below, in addition to the other information included or incorporated by reference in this Form 10-K, before making an investment decision regarding our common stock. If any of the following risks were to actually occur, our business, financial condition or operating results would likely suffer, possibly materially, the trading price of our common stock could decline, and you could lose part or all of your investment. Additional risks and uncertainties that we are unaware of, or that we currently believe are not material, may also become important factors that adversely affect our business.
Risks Related to Our Business and Industry
Our success depends in significant part on our ability to offer innovative products and solutions in response to dynamic and rapidly evolving market demand.
To succeed in our market, we must offer innovative products and solutions. Innovation requires that we accurately predict future market trends and customer expectations, and that we quickly adapt our development efforts in response. We must also protect our product roadmap and new product initiatives from leaks that might reduce or eliminate any innovative edge that we seek. Predicting market trends is difficult because our market is dynamic and rapidly evolving. Additionally, given the complex, sophisticated nature of our solutions and our typically lengthy product development cycles, we may not be able to rapidly change our product direction or strategic course. If we are unable to accurately predict market trends or adapt to evolving market conditions, we may be unable to capture customer demand and our market reputation and financial performance will be negatively affected. Even to the extent we make accurate predictions and possess the requisite flexibility to adapt, we may be able to pursue only some of the possible innovations due to limited resources. Our success, therefore, further depends on our ability to identify and focus on the most promising innovations.
Our success also depends on our ability to manage a number of risks associated with new products that we introduce, including timely and successful product launch, market acceptance, and the availability of products in appropriate locations, quantities, and costs to meet demand. Our efforts may not be successful in the near future, or at all, and our competitors may take significant market share in similar efforts. If we fail to develop new products and to manage new product introductions and transitions properly, our financial condition and operating results could be harmed.
The novel coronavirus, or COVID-19, and actions taken in response to it have adversely affected our business and are likely to continue to adversely affect our business, financial condition and results of operations.
The COVID-19 pandemic has been the source of economic disruption, and has led to federal, state and local governments enacting various restrictions in an attempt to limit the spread of the virus. It has also prompted limitations on social or public gatherings and other social distancing measures, such as office closures, shelter in place orders, working remotely, travel restrictions and quarantines, some of which continue in some places.
We have taken, and may take in the future either in response to COVID-19 resurgence or other public health concerns, actions as required by government authorities or that we determine are in the best interests of our employees, customers, manufacturers, and suppliers that diminish our ability to promote our products and services, and deliver required on-site professional services, including on-site support to our customers and users, and that could negatively impact our business and results of operations.
The COVID-19 pandemic, along with its variants and progeny, has significantly increased economic and demand uncertainty, which has caused a decline in the media, entertainment, and sports industries and, in turn, reduced demand for our products and services. These factors are expected to continue to reduce demand for our products and services, possibly significantly, including causing delays in purchasing and projects by our enterprise customers and channel partners. Additionally, the provision of on-site professional service may be impacted for a prolonged period of time due to site restrictions and related costs and delays, further impacting our business.
The COVID-19 pandemic and the response to it has and continues to adversely impact our operations and supply chain. If such impacts continue as a result of the ongoing pandemic, we could experience further interruptions in our supply chain, along with limitations in our and our manufacturers’ ability to timely procure products or their components and our ability to perform critical functions. Supply chain disruptions could also be exacerbated by and compounded with disruptions and limitations related to geopolitical instability, armed conflict and insurrection or the threat thereof, and other related conflict. The current conflict in
11
Ukraine, including indirect impacts as a result of sanctions and economic disruption, may further complicate such supply chain disruptions. These limitations could significantly hamper our ability to supply our products to our customers. If we encounter delays or difficulties in the manufacturing process that disrupt our ability to supply our products, we may not be able to satisfy customer demand or we may experience a product stock shortage or outage, which would likely have a material adverse effect on our business.
If the pandemic causes economic conditions to worsen, we expect to experience additional adverse impacts on our operations and revenues and our collections of accounts receivable, which may be material.
Further, COVID-19 has led to periods of disruption and volatility in the global capital markets. If these conditions continue to recur, the cost of capital could increase and access to capital could be impaired. If we experience deterioration in demand and our cash flows from operations decrease, we may require additional funding and may not be able to obtain such funding on favorable terms, or at all.
The degree to which COVID-19, along with its variants and progeny, impacts our results going forward will depend on future developments, which remain uncertain and cannot be predicted, including, but not limited to, the duration, spread and severity of COVID-19 and its variants and progeny, the actions to contain the virus or treat its impact, and the timing and pace of the economy and operating conditions stabilizing and returning to normal. Any of the foregoing factors, or other cascading effects of the COVID-19 pandemic that are not currently foreseeable, could materially increase our costs, negatively impact our business and damage our results of operations and our liquidity position, possibly to a significant degree.
Our emphasis on a cloud strategy may give rise to risks that could harm our business.
Our cloud strategy requires continued investment in product development and cloud operations, where we have a relatively limited operating history. Our cloud strategy has also led to changes in the way we price and deliver our products. Many of our competitors may have advantages over us due to their larger market presence, larger developer network, deeper experience in the cloud-based computing market, and greater sales and marketing resources. It is uncertain whether our cloud strategy will prove successful, or whether we will be able to develop the necessary infrastructure and business models more quickly than our competitors. Our cloud strategy may give rise to a number of risks, including the following:
•Our customers may prefer perpetual licenses, and we may not be as successful as we anticipate in selling subscriptions;
•although we intend to support our perpetual license business, the increased emphasis on a cloud strategy has raised concerns among some of our installed customer base who prefer perpetual licensing;
•we may be unsuccessful in achieving our target pricing;
•our revenues might decline over the short or long term as a result of this strategy;
•our relationships with existing partners that resell perpetual licenses may be damaged; and
•we may incur costs at a higher than forecasted rate as we enhance and expand our cloud operations.
Certain of our enterprise offerings have long and complex sales cycles, which could result in a loss of customers and lower revenues.
Certain of our enterprise offerings have long and complex sales cycles. The length and complexity in these sales cycles are due to a number of factors, including, among other things, the need for our sales representatives to educate customers about the uses and benefits of our products and services, the desire of large and medium size organizations to undertake significant evaluation processes to determine their technology requirements prior to making information technology expenditures, and the need to negotiate large, complex, enterprise-wide contracts. These long and complex sales cycles could make it difficult to retain and win customers and could results in lower revenues.
We spend substantial time and money on our sales efforts without any assurance that potential customers will ultimately purchase our solutions. As we target our sales efforts at larger enterprise customers, these trends are expected to continue. Our long and complex sales cycle for these products makes it difficult to predict when a given sales cycle will close.
There are a number of financial and accounting risks in our subscription model.
12
A growing portion of our revenue is subscription-based pursuant to service and subscription agreements that are generally month-to-month or one year in length, and we intend to continue to expand our subscription-based offerings. Although the subscription model is designed to increase the number of customers who purchase our products and services on a recurring basis and create a more predictable revenue stream, there are certain risks inherent in a subscription-based model. These risks include the risk that customers will not renew their subscriptions, risks related to the timing of revenue recognition as described below, and the risk of potential reductions in cash flows. Although many of our service and subscription agreements contain automatic renewal terms, generally, our customers have no obligation to renew their subscriptions for our services after the expiration of their initial subscription period. If customers do renew their subscriptions, these subscriptions may not be renewed on the same terms. Moreover, under certain circumstances, some of our customers have the right to cancel their service agreements prior to the expiration of the terms of their agreements. If our customers do not renew their subscriptions for our services or if they renew on terms less favorable to us, our revenues may decline. Our future growth is also affected by our ability to sell additional features and services to our current customers, which depends on a number of factors, including customers' satisfaction with our products and services, the prices of our offerings, and general market conditions. If our efforts to cross-sell and upsell to our customers are unsuccessful, the rate at which our business grows may decline.
A portion of the subscription-based revenue we report each quarter results from the recognition of deferred revenue relating to subscription agreements entered into during previous quarters. A decline in new or renewed subscriptions in any period may not be immediately reflected in our reported financial results for that period but may result in a decline in our revenue in future quarters. If we were to experience significant downturns in subscription sales and renewal rates, our reported financial results might not reflect such downturns until future periods. Our subscription model could also make it difficult for us to rapidly increase our revenues from subscription-based services through additional sales in any period, as revenue from new customers will be recognized over the applicable subscription term. Further, any increases in sales under our subscription sales model could result in decreased revenues over the short term if these sales are offset by a decline in sales from perpetual license customers. If any of our assumptions about revenue from our new businesses or our addition of a subscription-based model prove incorrect, our actual results may differ materially from those anticipated, estimated, or projected. We may be unable accurately to predict subscription renewal rates and the impact these rates may have on our future revenue and operating results.
We operate in highly fragmented and competitive markets, and our competitors may be able to draw upon a greater depth and breadth of resources than those available to us.
We operate in highly fragmented and competitive markets characterized by pressure to innovate, expand feature sets and functionality, accelerate new product releases, and reduce prices. Markets for certain of our products have limited barriers to entry meaning that new and existing competitors with greater flexibility and market responsiveness may seize opportunities which we are not currently aligned to seize ourself. Also, the fragmentation in our markets creates an additional risk of consolidation among our competitors, which would result in fewer, more effective competitors. Customers consider many factors when evaluating our products relative to those of our competitors, including innovation, ease of use, price, feature sets, functionality, reliability, performance, reputation, and training and support, and we may not compare favorably against our competitors in all respects. Some of our current and potential competitors have longer operating histories, greater brand recognition, and substantially greater financial, technical, marketing, distribution, and support resources than we do. As a result, our competitors may be able to deliver greater innovation, respond more quickly to new or emerging technologies and changes in market demand, devote more resources to the development, marketing and sale of their products, successfully expand into emerging and other international markets, or price their products more aggressively than we can. If our competitors are more successful than we are in developing products, or in attracting and retaining customers, our financial condition and operating results could be adversely affected.
We obtain certain hardware product components and finished goods under sole-source supplier arrangements. Disruptions to these arrangements and other supply chain interruptions could jeopardize the manufacturing or distribution of certain of our hardware products.
Although we generally prefer to establish multi-source supply arrangements for our hardware product components and finished goods, multi-source arrangements are not always possible or cost-effective, and therefore we rely on sole-source suppliers for some of our hardware product components and finished goods. Reliance on sole source suppliers increases our susceptibility to supply chain limitations and interruptions. We do not generally carry significant inventories of, and may not in all cases have guaranteed supply arrangements for, these sole-sourced items. Our sole-source suppliers may cease, suspend, or otherwise limit production or shipment of our product components, or they may terminate our agreements or adversely modify supply terms or pricing, due to, among other things, macroeconomic events, political crises, natural or environmental disasters, labor shortages, or other unforeseen occurrences outside the control of us or our suppliers. Supply chain disruptions due to the conflict in Ukraine
13
and any indirect effects may further complicate existing supply chain constraints. If any of these events occur, our ability to manufacture, distribute, and service our products would be impaired, and our business could be significantly harmed. We may not be able to obtain sole-sourced components or finished goods, or acceptable substitutes, from alternative suppliers or on commercially reasonable terms. If we are forced to change sole-source suppliers due to a contract termination or other production cessation, it may take a significant amount of time and expenses to obtain substitute suppliers, during which time our inventory may be significantly reduced, which may adversely impact our business, financial condition and results of operations. We may also be required to expend significant development resources to redesign our products to work around the exclusion of any sole-sourced component or accommodate the inclusion of any substitute component. Although we have procedures in place to mitigate the risks associated with our sole-sourced suppliers, we cannot be certain that we will be able to obtain sole-sourced components or finished goods from alternative suppliers or that we will be able to do so on commercially reasonable terms without a material impact on our results of operations or financial position.
A natural disaster or catastrophic event may significantly limit our ability to conduct business as normal and harm our business.
Our operations, and the operations of our customers, are vulnerable to interruptions by natural disasters and catastrophic events, including pandemics such as the COVID-19 pandemic, as well as political unrest including armed conflicts such as the Russian invasion of Ukraine. We operate a complex, geographically dispersed business, which includes significant personnel, customers and facilities in California near major earthquake fault lines and in Manila which is subject to sever weather from typhoons and volcanic activity. We may not be able to protect our company from, and we are predominantly uninsured for, business continuity losses and disruptions caused by such catastrophic events. Disruption or failure of our or our customers’ networks or systems, or injury or damage to either parties’ personnel or physical infrastructure, caused by a natural disaster, public health crisis, terrorism, cyber-attack, political unrest, acts of war or armed conflict, or other catastrophic event may significantly limit our or our customers’ ability to conduct business as normal, including our ability to communicate and transact with customers, suppliers, distributors, and resellers, which may negatively affect our revenues and operating results. Additionally, a natural disaster or catastrophic event could cause us or our customers to suspend all or a portion of operations for a significant period of time, result in a permanent loss of resources, and require the relocation of personnel and material to alternate facilities that may not be available or adequate. Such an event could also cause an indirect economic impact on our customers, which could affect our customers’ purchasing decisions and reduce demand for our products and services. There could also be disruptions to our supply chain as a result of such events. We may also experience disruption to our internal operations if we are forced to restrict employee travel, cancel events with customers or partners, or even close office facilities as a result of such events. Any significant disruption resulting from such events on a large scale or over a prolonged period of time could cause significant delays and disruption to our business until the Company would be able to resume normal business operations or shift to other third-party vendors, negatively affecting our revenue and other financial results. A prolonged disruption of our business could also damage our reputation, particularly among our global news organization customers who are likely to require our solutions and support during such time. Any of these factors could cause a material adverse impact on our financial condition and operating results.
Lengthy procurement lead times and unpredictable life cycles and customer demand for some of our products may result in significant inventory risks, which could adversely affect our results of operations.
With respect to many of our products, particularly our audio products, we must procure component parts and build finished inventory far in advance of product shipments. Certain of these products may have unpredictable life cycles and encounter rapid technological obsolescence as a result of dynamic market conditions. We procure product components and build inventory based upon our forecasts of product life cycle and customer demand. If we are unable to accurately forecast product life cycle and customer demand or unable to manage our inventory levels in response to shifts in customer demand, the result may be insufficient, excess, or obsolete product inventory. Insufficient product inventory may impair our ability to fulfill product orders and negatively affect our revenues, while excess or obsolete inventory may require a write-down on products and components to their net realizable value, which would negatively affect our results of operations.
Our revenue backlog estimates are based on certain assumptions and are subject to unexpected adjustments and cancellations, and backlog orders may not be timely converted to revenues in any particular fiscal period, if at all, or be indicative of our actual operating results for any future period.
Our revenue backlog, as we define it, consists of firm orders received and includes both (i) orders where the customer has paid in advance of our performance obligations being fulfilled, which are reflected as deferred revenues on our balance sheet, and (ii)
14
orders for future product deliveries or services that have not yet been invoiced by us. To the extent that our customers cancel their orders with us, or reduce their requirements during a particular period for any reason, we will not realize revenue or profit from the associated revenue backlog. Even where a project proceeds as scheduled, it is possible that the customer may default and fail to pay amounts owed to us. Material delays, payment defaults, or cancellations could reduce the amount of revenue backlog currently reported, and consequently, could inhibit the conversion of that backlog into revenues. Furthermore, orders included in our revenue backlog may not be profitable. We may experience variances in the realization of our revenue backlog because of project delays or cancellations resulting from external market factors and economic factors beyond our control. In addition, even if we realize all of the revenue from the projects in our revenue backlog, if our expenses associated with these projects are higher than expected, our results of operations and financial condition would be adversely affected.
Our revenues and operating results depend significantly on our third-party reseller and distribution channels. Our failure to effectively manage our distribution channels for our products and services could adversely affect our revenues and gross margins and therefore our profitability.
We distribute many of our products indirectly through third-party resellers and distributors. We also distribute products directly to end-user customers. Successfully managing the interaction of our direct and indirect channel efforts to reach various potential customer industries for our products and services is a complex process. For example, in response to our direct sales strategies or for other business reasons, our current resellers and distributors may from time to time choose to resell our competitors’ products in addition to, or in place of, our products. Moreover, since each distribution method has distinct risks and gross margins, our failure to identify and implement the most advantageous balance in the delivery model for our products and services could adversely affect our revenues and gross margins and therefore our profitability.
Acquisitions and investments could be difficult to consummate and integrate into our operations, and they could disrupt our business, dilute stockholder value, or impair our financial results.
As part of our business strategy, from time to time we may seek to grow our business through acquisitions of or investments in new or complementary businesses, technologies, or products that we believe can improve our ability to compete in our existing customer markets or allow us to enter new markets. There are numerous risks associated with acquisitions and investment transactions including, but not limited to, failing to realize anticipated benefits of acquisitions or returns on investment, unanticipated costs and liabilities associated with the acquisition, and difficulty assimilating the operations, policies and personnel of the acquired business.
Our products may experience defects that could negatively impact our customer relationships, market reputation, and operating results.
Our software products occasionally include coding defects (commonly referred to as “bugs”), which in some cases may interfere with or impair a customer’s ability to operate or use the software. Similarly, our hardware products could include design or manufacturing defects that could cause them to malfunction. The quality control measures we use are not designed or intended to detect and remedy all defects. Any product defects could result in loss of customers or revenues, delays in revenue recognition, increased product returns, damage to our market reputation, and significant warranty or other expense and could have a material adverse impact on our financial condition and operating results.
Our revenues and operating results are difficult to predict and may fluctuate from period to period.
Our results of operations have been, and may continue to, be subject to significant quarterly variation. Our revenues and operating results for any particular quarter may also vary due to a number of factors, including, but not limited to, those enumerated under the section “Cautionary Note on Forward-Looking Statements,” appearing elsewhere in this Form 10-K and:
•the timing of large or enterprise-wide sales and our ability to recognize revenues from such sales;
•demand planning and logistics;
•renewal rates under subscription contracts;
•reliance on third-party reseller and distribution channels;
•disruptions in our supply chain;
•changes in operating expenses;
15
•price protections and provisions for inventory obsolescence extended to resellers and distributors;
•seasonal factors, such as higher consumer demand at year-end; and
•complex accounting rules for revenue recognition.
The occurrence and interaction of these variables may cause our revenues and operating results to fluctuate from period to period. As a result, period-to-period comparisons of our revenues and operating results may not provide an adequate indication of our future performance. We cannot be certain when, or if, our operations will be profitable in future periods.
Risks related to our internal controls over financial reporting
Risks related to material weakness in our internal controls.
We may not be able to properly remediate existing or future weaknesses or deficiencies in our internal control environment, which could adversely affect our ability to produce accurate and timely financial statements, harm our reputation, negatively impact our stock price and damage our business.
In connection with filing our Annual Report on Form 10-K for fiscal year 2022, a material weakness was identified related to controls associated with the accounting methodology used to determine the amount and timing of revenue associated with multiple performance obligations under term based subscription contracts.
While we continue with our efforts to remediate the identified weaknesses, we cannot assure you that our remediation efforts will be adequate to avoid future material weaknesses. We also cannot assure you that additional material weaknesses in our internal controls over financial reporting will not arise or be identified in the future. We intend to continue our control remediation activities and also to continue to improve our operational, information technology, financial systems, and infrastructure, procedures and controls, as well as to continue to expand, train, retain, and manage our personnel who are essential to effective internal control. In doing so, we will continue to incur expenses and expend management time on compliance-related issues.
If we fail to successfully remediate our material weaknesses and implement appropriate controls, we may not be able to prevent or detect a material misstatement in our financial statements on a timely basis or at all. Such misstatements could result in a future restatement of our financial statements, could cause us to fail to meet our reporting obligations, or could cause investors to lose confidence in our reported financial information, leading to a decline in our stock price or litigation. Furthermore, our reputation could be harmed and our customers’ and partners’ confidence in us may be impaired, all of which could damage our business. For a discussion of the material weaknesses, please see Part II, Item 9A, “Controls and Procedures,” of this Form 10-K.
Risks related to changes in accounting guidance and interpretation.
Accounting guidance may change over time, and some of these changes and related accounting treatments may be subjective in nature. To the extent such changes in accounting guidance occur, different accounting firms may evolve in their views as an institution on interpretation and application of certain accounting treatments, which may in turn cause us to adjust how we treat certain items from an accounting standpoint. If we make such adjustments, it may materially impact our financial results and any earnings guidance we have previously given.
Risks Related to Intellectual Property
Our intellectual property and trade secrets are valuable assets that could be impaired by third-party infringement and misappropriation.
As a technology company, our intellectual property and trade secrets are among our most valuable assets. Infringement or misappropriation of these assets can result in lost revenues, and thereby ultimately reduce their value. We rely on a combination of patent, copyright, trademark, and trade secret laws, as well as confidentiality procedures, contractual provisions, and anti-piracy technology in certain products to protect our intellectual property. Most of these tools require vigilant monitoring of competitor and other third-party activities and of end-user usage of our products to be effective. These tools may not provide adequate protection in all instances, may be subject to circumvention, or may require a vigilance that in some cases exceeds our capabilities or resources. Additionally, our business model is increasingly focused on software products and, as we offer more software products, our revenues may be more vulnerable to loss through piracy and other infringement. The legal regimes of certain foreign jurisdictions in which we operate may not protect our intellectual property to the same extent as do the laws of the
16
United States. These concerns may be heightened in areas of geopolitical conflict, such as Russian occupied areas of Ukraine, where law enforcement may not provide physical security sufficient to protect hard assets containing our intellectual property. If our intellectual property is misappropriated in foreign jurisdictions, we may be without adequate remedies to address these issues. Regardless of jurisdiction, assuming legal protection exists, and infringement or misappropriation is detected, any enforcement action that we may pursue could be costly and time-consuming, the outcome will be uncertain, and the alleged offender in some cases may seek to have our intellectual property rights invalidated. If we are unable to protect our intellectual property and trade secrets, our business could be harmed.
Our results could be materially adversely affected if we are accused of, or found to be, infringing third parties’ intellectual property rights.
Technological change in our industry, extensive and sometimes uncertain patent coverage, and the rapid issuance of new patents, result in the possibility that certain of our products or business methods may infringe the patents or other intellectual property rights of third parties. Companies in the technology industry own large numbers of patents, copyrights, trademarks, and trade secrets and frequently enter into litigation based on allegations of infringement or other violations of intellectual property rights. Our technologies may not withstand third-party claims against their use. We have in the past, and may in the future receive claims and be subject to litigation alleging that we infringe patents owned by third parties. Regardless of the scope or validity of such patents, or the merits of any patent claims by potential or actual litigants, we could incur substantial costs in defending intellectual property claims and litigation, and such claims and litigation could distract management’s attention from normal business operations. In addition, we provide indemnification provisions in agreements with certain customers covering potential claims by third parties of intellectual property infringement. These agreements generally provide that we will indemnify customers for losses incurred in connection with an infringement claim brought by a third party with respect to our products, and we have received claims for such indemnification. The results of any intellectual property litigation to which we are, or may become, a party, or for which we are required to provide indemnification, may require us to:
•cease selling or using products, features, or services that incorporate the challenged intellectual property;
•make substantial payments for legal fees, settlement payments or other costs or damages;
•obtain a license, which may not be available on reasonable terms, to sell or use the relevant technology, which such license could require royalties that would significantly increase our cost of goods sold; or redesign products or services to avoid infringement, where such redesign could involve significant costs and result in delayed and/or reduced sales of the affected products.
We depend on the availability and proper functioning of certain third-party technology that we incorporate into or bundle with our products. Third-party technology may include defects or errors that could adversely affect the performance of our products. If third-party technology becomes unavailable at acceptable prices, we may need to expend considerable resources integrating alternative third-party technology or developing our own substitute technology.
The profit margin for some of our products depends in part on the royalty, license, and purchase fees we pay in connection with third-party technology which we license for incorporation into our product bundling. Our profit margins and operating results can be adversely affected by increases in the costs associated with such third party technology. In addition to cost implications, third-party technology may include defects or errors that could adversely affect the performance of our products, which may harm our market reputation or adversely affect our product sales. Third-party technology may also include certain open source software code that if used in combination with our own software may jeopardize our intellectual property rights or limit our ability to sell through certain sales channels. If any third-party technology license expires, is terminated, or ceases to be available on commercially reasonable terms, we may be required to expend considerable resources integrating alternative third-party technology or developing our own substitute technology. In the interim, sales of our products may be delayed or suspended, or we may be forced to distribute our products with reduced feature sets or functionality.
Risks Related to Our Liquidity and Financial Condition and Performance
If we are not able to generate and maintain adequate liquidity our ability to operate our business could be adversely affected.
17
Generating and maintaining adequate liquidity is important to our business operations. We meet our liquidity needs primarily through cash generated by operations, supplemented from time to time with the proceeds of long-term debt and borrowings under our revolving credit facility, governed by the Second Amended and Restated Credit Agreement, dated October 6, 2022, among us, the lenders party thereto, and JPMorgan Chase Bank, N.A., as administrative agent, (the “Second A&R Credit Agreement). We have the ability to borrow up to $120.0 million under the revolving credit facility (the “Revolving Credit Facility”). We have also undertaken significant cost cutting measures and we may take additional measures to further improve our liquidity. Significant fluctuations in our cash balances could harm our ability to meet our immediate liquidity needs, impair our capacity to react to sudden or unexpected contractions or growth in our business, reduce our ability to withstand a sustained period of economic downturn, and impair our ability to compete with competitors with greater financial resources. In addition, fluctuations in our cash balances could cause us to draw on our Revolving Credit Facility and therefore reduce funds available for future borrowing under the Revolving Credit Facility (see “Management’s Discussion and Analysis of Financial Condition and Results of Operations - Liquidity and Capital Resources” in Item 7 of this Form 10-K). If we are unable to generate sufficient cash flow or our borrowings are not sufficient, our liquidity may significantly decrease, which could have an adverse effect on our business.
Restrictions in the Second A&R Credit Agreement may limit our activities.
The Second A&R Credit Agreement contains restrictive covenants that limit our ability to engage in activities that could otherwise benefit us, including, among other things, limitations on our ability to make investments, incur additional indebtedness, sell assets, pay dividends, make other restricted payments, and create liens on our assets. We are also required to comply on an ongoing basis with a maximum total net leverage ratio ratio financial covenant. Our ability to comply with these restrictions and financial covenant in the future is uncertain and could be affected by our cash flows from operations and events or circumstances beyond our control. Failure to comply with any of these restrictions or covenants may result in an event of default under the Second A&R Credit Agreement, which could permit acceleration of the outstanding term loans and Revolving Credit Facility borrowings under the Second A&R Credit Agreement and require us to repay such indebtedness before its scheduled due date. Certain events of default under the Second A&R Credit Agreement may also give rise to a default under other future indebtedness. If an event of default were to occur, we might not have sufficient funds available to make the payments required. If we are unable to repay amounts owed, our lenders may be entitled to foreclose on and sell substantially all of our assets, which secure our borrowings under the Second A&R Credit Agreement.
Our substantial indebtedness could adversely affect our business, cash flow and results of operations.
As of December 31, 2022, we had $182.7 million of indebtedness, including borrowings under our Second A&R Credit Agreement. This level of indebtedness may:
•require us to dedicate a greater percentage of our cash flow from operations to payments on our debt, thereby reducing the availability of cash flow to fund capital expenditures, pursue other acquisitions or investments, and use for general corporate purposes;
•increase our vulnerability to general adverse economic conditions, including increases in interest rates with respect to borrowings under the Second A&R Credit Agreement that bear interest at variable rates or challenges in refinancing our indebtedness in the future; and
•limit our ability to obtain additional financing;
•These and other factors limit our flexibility in planning for, or reacting to, changes in or challenges relating to our business and industry, creating competitive disadvantages compared to other competitors with lower debt levels and borrowing costs.
Our cash flow from operations, combined with any additional borrowings available to us, may not be sufficient to enable us to repay our indebtedness, or to fund other liquidity needs. We may incur additional indebtedness in the future, which could cause these risks to intensify. If we are unable to generate sufficient cash flows to repay our indebtedness when due or to fund our other liquidity needs, we may be required to pursue one or more alternatives, such as selling assets, restructuring debt, or obtaining additional equity capital on terms that may be onerous or highly dilutive. Our ability to refinance our indebtedness will depend on the capital markets and our financial condition at such time. We may not be able to engage in any of these activities or engage in these activities on desirable terms, which could result in a default on our debt obligations.
Risks Related to Our International Operations
18
Our international operations expose us to legal, regulatory, political and other risks including the risk of international instability and conflict.
We derive more than half of our revenues from customers outside of the United States, and we rely on foreign contractors for the supply and manufacture of many of our products. Sales to customers outside the United States accounted for 57%, 58% and 60% of our total net revenues in 2022, 2021 and 2020, respectively. We also conduct significant information technology, research and development activities overseas, including through third-party development vendors. For example we have customer support activities in the Philippines, and we have operations in Poland and Israel. Additionally, a portion of our research and development is outsourced to contractors based in Kiev, Ukraine, who have been relocated since the Russian invasion of Ukraine.
Our international operations expose us to a variety of risks, including:
•the financial and administrative burdens associated with environmental, tax, labor and employment, and export laws, as well as other business regulations, in foreign jurisdictions, including high compliance costs, inconsistencies among jurisdictions, and a lack of administrative or judicial interpretative guidance;
•fluctuations in foreign currency exchange rates;
•regional economic downturns;
•economic, social, and political instability, security concerns, and the risk of war or armed conflict, particularly in areas of heightened geopolitical tension and open conflict such as Ukraine where we have outsourced research and development activities;
•reduced or varied protection for intellectual property rights in some countries;
•longer collection cycles for accounts receivable;
•difficulties in enforcing contracts;
•difficulties in managing and staffing international implementations and operations, and executing our business strategy internationally;
•difficulties managing a global labor force;
•potentially adverse tax consequences, including the complexities of foreign value added or other tax systems and restrictions on the repatriation of earnings;
•increased financial accounting and reporting burdens and complexities;
•difficulties in maintaining effective internal control over financial reporting and disclosure controls;
•costs and delays associated with developing products in multiple languages; and
•foreign exchange controls, sanctions, moratoria, and other financial and transactional boundaries that may prevent or limit our ability to repatriate income earned, make or receive payments, or execute transactions in foreign markets.
Our presence in Europe contributes to compliance uncertainty regarding certain transfers of personal data from Europe to the United States. The General Data Protection Regulation, or GDPR, which became effective in the European Union, or EU, in 2018, applies to any of our activities conducted from an establishment in the EU or related to products and services that we offer to EU users. The GDPR created a range of new data privacy related compliance obligations, which could cause us to change our business practices, and will significantly increase financial penalties for noncompliance, including possible fines of up to 4% of global annual turnover for the preceding financial year or €20 million (whichever is higher) for the most serious infringements.
We may not be successful in developing, implementing, or maintaining policies and strategies that will be effective in managing the varying risks in each country where we do business. Our failure to manage these risks successfully, including developing appropriate contingency plans for our outsourced research and development work, could harm our international operations, reduce our international sales, and increase our costs, thus adversely affecting our business, operating results, and financial condition.
Fluctuations in foreign exchange rates may result in short-term currency exchange losses and could adversely affect our revenues from foreign markets and our manufacturing costs in the long term.
Our international sales are largely transacted through foreign subsidiaries and generally in the currency of the end-user customers. Consequently, we are exposed to short-term currency exchange risks that may adversely affect our revenues, operating results,
19
and cash flows. The majority of our international sales are transacted in euros. We do not have a regular practice of entering into foreign currency contracts to hedge foreign exchange risks.
Furthermore, the significance of sales in Europe subjects us to risks associated with long-term changes in the dollar/euro exchange rate. A sustained strengthening of the U.S. dollar against the euro would decrease our expected future U.S. dollar revenues from European sales, and could have a significant adverse effect on our overall profit margins. Continuing uncertainty regarding economic conditions, including inflation and economic instability in the Eurozone, could lead to significant long-term economic weakness and reduced economic growth in Europe, the occurrence of which, or the potential occurrence of which, could lead to a sustained strengthening of the U.S. dollar against the euro, adversely affecting the profitability of our European operations.
In addition, we source and manufacture many of our products in China and our costs may increase should the renminbi not remain stable against the U.S. dollar. Although the renminbi is pegged against a basket of currencies determined by the People’s Bank of China, the renminbi may appreciate or depreciate significantly in value against the U.S. dollar in the long term. In addition, if China were to permit the renminbi to float to a free market rate of exchange, it is widely anticipated that the renminbi would appreciate significantly in value against U.S. dollar. An increase in the value of the renminbi against the U.S. dollar would have the effect of increasing the labor and production costs of our Chinese manufacturers in U.S. dollar terms, which may result in their passing such costs to us in the form of increased pricing, which would adversely affect our profit margins if we could not pass those price increases along to our customers or obtain alternate suppliers or obtain alternate suppliers.
Global economic weakness and uncertainty could adversely affect our revenues, gross margins and expenses.
Our business is impacted by global economic conditions, which have been in recent years, and continue to be, volatile. Geopolitical conflict, such as the Russian invasion of Ukraine, and related international sanctions and their impact may exacerbate this volatility. Specifically, our revenues and gross margins depend significantly on global economic conditions and the demand for our products and services in the markets in which we compete. Economic weakness and uncertainty have resulted, and may result in the future, in decreased revenue, gross margin, earnings or growth rates, and difficulty managing inventory levels. Sustained uncertainty about global economic conditions may adversely affect demand for our products and services and could cause demand to differ materially from our expectations as customers curtail or delay spending on our products and services. Economic weakness and uncertainty also make it more difficult for us to make accurate forecasts of revenues, gross margins and expenses.
Our international operations create the risk that we could violate the U.S. Foreign Corrupt Practices Act, the U.K. Bribery Act and/or similar foreign anti-corruption laws.
We operate in a number of foreign jurisdictions. The U.S. Foreign Corrupt Practices Act, or FCPA, and similar foreign anti-corruption laws generally prohibit companies and their intermediaries from offering, promising, authorizing, or making payments to foreign officials for the purpose of influencing any act or decision of such official in his or her official capacity, inducing the official to do any act in violation of his or her lawful duty, or to secure any improper advantage in obtaining or retaining business. Recent years have seen a substantial increase in the global enforcement of anti-corruption laws, with more frequent voluntary self-disclosures by companies, aggressive investigations and enforcement proceedings by both the U.S. Department of Justice and the SEC resulting in record fines and penalties, increased enforcement activity by non-U.S. regulators, and increases in criminal and civil proceedings brought against companies and individuals.
We operate in a number of countries that are recognized as having governmental corruption problems to some degree and where local customs and practices may pose compliance risks with regard to anti-corruption laws, including China. Our continued operation and expansion outside the United States could expand the risk of such violations in the future.
Although we have policies that mandate compliance with these anti-corruption laws and require training, we cannot guaranty that these policies and procedures will protect us from unauthorized reckless or criminal acts committed by our employees or agents. In the event that we believe or have reason to believe that our employees or agents have or may have violated applicable anti-corruption laws, including the FCPA, we may be required to investigate or have outside counsel investigate the relevant facts and circumstances, which can be expensive and require significant time and attention from senior management. Violations of these laws may result in significant criminal or civil sanctions, which could disrupt our business and result in a material adverse effect on our reputation, business, results of operations, or financial condition.
20
We rely to a significant extent on manufacturing and hardware development vendors with operations in foreign jurisdictions. This may reduce our control over the manufacturing activities, create uncertainty with respect to intended cost savings and expose our proprietary assets to greater risk of misappropriation. Changes to these vendor relationships may result in delays or disruptions that could harm our business.
We rely to a significant extent on vendors for the development and manufacture of certain of our hardware products, primarily in Mexico. These relationships provide us with more flexible resource capabilities, access to global talent, and cost savings, but also expose us to risks that may not exist or may be less pronounced with respect to our internal operations. We are able to exercise only limited oversight of our contractors, including with respect to their engineering and manufacturing processes, resource allocations, delivery schedules, security procedures, and quality control. Language, cultural, and time zone differences complicate effective management of contractors located abroad. Additionally, competition for talent in certain locations may lead to high turnover rates that disrupt development or manufacturing continuity. The manufacturers we use also manufacture products for other companies, including our competitors. Our contractors could choose to prioritize capacity for other users, increase the prices they charge us or reduce or eliminate deliveries to us, which could have a material adverse effect on our business. Pricing terms offered by contractors may be highly variable over time reflecting, among other things, order volume, local inflation, and exchange rates. Some of our contractor relationships are based on broader contractual arrangements, while others operate on a more narrow purchase order basis, where we do not have the same contractual protections with respect to pricing or other critical terms.
Many of our contractors require access to our intellectual property and our confidential and proprietary information to perform their services. Protections for these assets in some non-U.S. jurisdictions may be less robust than in the United States. We must rely on policies and procedures we have instituted with our contractors and certain confidentiality and contractual provisions in our written agreements, to the extent they exist, for protection. These safeguards may be inadequate to prevent breaches. If a breach were to occur, available legal or other remedies may be limited or otherwise insufficient to compensate us for any resulting damages.
Furthermore, if one of our international vendors were, for any reason, to cease or experience significant disruptions in its operations, among others as a result of political unrest, we might be unable to replace it on a timely basis with a comparably priced provider. We would also have to expend time and resources to train any new development or manufacturing vendor. If any of the vendors were to suffer an interruption in its business, or experience delays, disruptions, or quality control problems in development or manufacturing operations, or if we had to change development or manufacturing vendors, our ability to provide services to our customers would be delayed and our business, operating results and financial condition would be adversely affected.
Other Risks Related to our Business
Failure of our information systems or those of third parties or breaches of data security could cause significant harm to our business.
Our systems and processes involve the storage and transmission of proprietary information and sensitive or confidential data, including personal information of employees, customers, and others. In addition, we rely on information systems controlled by third parties. Information system failures, network disruptions, and system and data security breaches, manipulation, destruction, ransom, or leakage, whether intentional or accidental, could impair our ability to provide services to our customers or otherwise harm our ability to conduct our business. Any such failures, disruptions or breaches could also impede the development, manufacture or shipment of products, interrupt or delay processing of transactions and reporting financial results, result in theft or misuse of our intellectual property or other assets, or result in the unintentional disclosure of personal, proprietary, sensitive, or confidential information of employees, customers, and others. These concerns may be heightened due to instability and/or failure of the rule of law in areas of geopolitical conflict, such as Russian occupied areas of Ukraine. Our development and use of the Avid MediaCentral Platform, public and private marketplaces, cloud-based offerings, as well as our evolution toward an enterprise subscription model that requires us to host increasing amounts of customer data, increases the risk that our and our customers’ data and financial and proprietary information could be more susceptible to such failures and data breaches. In addition, the need for substantial numbers of our employees and partners to work remotely, such as due to the COVID-19 pandemic, the ongoing Russian invasion of Ukraine, and other crises, could create additional data security risks.
Information system failures or unauthorized access could be caused by our failure to adequately maintain and enhance our systems and networks, external theft or attack, misconduct by our employees, contractors, vendors, or external bad actors, or
21
many other causes such as power failures, earthquakes, fire, or other natural disasters. Our cyber security systems regularly detect threats of varying degrees of sophistication. Cyber threats are constantly evolving, increasing the difficulty of detecting and successfully defending against them. We may have no current capability to detect certain vulnerabilities, which may allow them to persist in the environment over long periods of time. Cyber threats can have cascading impacts that develop and unfold unpredictably across our internal networks and systems and those of our partners and customers.
Any information system failures or unauthorized access to our network or systems could expose us, our customers, or the individuals affected to a risk of loss or misuse of this information, resulting in litigation and potential liability for us. In addition, we could incur substantial costs related to detection and escalation, notification, and remediation costs, including costs associated with repairing our information systems, implementing further data protection measures, engaging third-party experts and consultants and related costs, and increased insurance premiums. In addition, significant or repeated reductions in the performance, reliability, security, or availability of our information systems and network infrastructure could lead to lost business and could significantly harm our brand and reputation and ability to attract and retain existing and potential users, customers, advertisers, and content providers.
Our success depends in part on our ability to hire and retain competent and skilled management and technical, sales, and other personnel.
We are dependent on the continued service and performance of our management team and key technical, sales, and other personnel and our success will depend in part on our ability to recruit and retain these employees in a competitive job market. If we fail to recruit and retain, including through competitive compensation, competent and skilled personnel, we may incur increased costs or experience challenges with the execution of our strategic plan. If we fail to properly implement proactive talent planning measures, such as voluntary early retirement programs and succession planning, we risk losing key institutional knowledge. Also, if we fail to maintain a diverse, inclusive and discrimination-free workplace, we risk losing employees.
Our competitors may in some instances be able to offer a work environment with higher compensation, more opportunities to work with cutting-edge technology, better training, experience, flexibility, or other more desirable benefits than we can. If we are unable to retain our key personnel or appropriately match skill sets with our needs, we would be required to expend significant time and financial resources to identify and hire new qualified personnel and to transfer significant internal historical knowledge, which might significantly delay or prevent the achievement of our business objectives. The COVID-19 pandemic and subsequent labor conditions, including record-low unemployment levels, has exacerbated the challenges we face in attracting, hiring, and retaining qualified personnel. The conflict in Ukraine may impact our ability to utilize outsourced service providers, which may strain personnel demands.
Risks Related to Our Stock
Delaware law and our charter documents may impede or discourage a takeover, which could reduce the market price of our common stock.
We are a Delaware corporation, and the anti-takeover provisions of Delaware law impose various impediments to the ability of a third party to acquire control of us, even if a change in control would be beneficial to our existing stockholders. In addition, our board of directors, or a committee thereof, has the power, without stockholder approval, to designate the terms of one or more series of preferred stock and issue shares of preferred stock. The ability of our board of directors to create and issue a new series of preferred stock and certain provisions of Delaware law and our certificate of incorporation and bylaws, could impede a merger, takeover or other business combination involving us, or discourage a potential acquirer from making a tender offer for our common stock, which, under certain circumstances, could reduce the market price of our common stock.
22
ITEM 1B.UNRESOLVED STAFF COMMENTS
None.
ITEM 2.PROPERTIES
We lease approximately 100,000 square feet in Burlington, Massachusetts for our principal corporate and administrative offices, as well as for significant R&D activities. The lease expires in May 2028.
We lease approximately 24,000 square feet in Dublin, Ireland for the final assembly and distribution of our products. We lease approximately 24,000 square feet in Manila, Philippines for our Asia operations, including customer support and administrative functions.
We also lease office space for sales operations and research and development in several other domestic and international locations.
ITEM 3.LEGAL PROCEEDINGS
We are involved in legal proceedings from time to time arising from the normal course of business activities, including claims of alleged infringement of intellectual property rights and contractual, commercial, employee relations, product or service performance, or other matters. Our industry is characterized by the existence of a large number of patents and frequent claims and litigation regarding patent and other intellectual property rights.
The outcome of legal proceedings and claims brought against us is subject to significant uncertainty and, as a result, our financial position or results of operations may be negatively affected by the unfavorable resolution of one or more of these proceedings for the period in which a matter is resolved. See Part I, Item 1A, “Risk Factors – Risks Related to our Intellectual Property - Our results could be materially adversely affected if we are accused of, or found to be, infringing third parties’ intellectual property rights.”
For a discussion of certain other legal matters and contingencies, see the discussion under “Contingencies” in Note K to the financial statements included in herein.
ITEM 4.MINE SAFETY DISCLOSURES
Not Applicable.
23
PART II
ITEM 5.MARKET FOR REGISTRANT’S COMMON EQUITY AND RELATED STOCKHOLDER MATTERS AND ISSUER PURCHASES OF EQUITY SECURITIES
Our common stock is listed on the Nasdaq Global Select Market under the symbol AVID. The approximate number of holders of record of our common stock at February 24, 2023 was 220. This number does not include stockholders for whom shares were held in a “nominee” or “street” name.
We have never declared or paid cash dividends on our capital stock, and we do not anticipate paying any cash dividends in the foreseeable future. Our Second A&R Credit Agreement restricts our ability to declare and pay dividends in cash on our capital stock under certain circumstances. Our Second A&R Credit Agreement permits us to pay up to 60% of Consolidated EBITDA in dividends in cash on our capital stock in any fiscal year if at the time of and immediately after giving effect (including giving effect on a pro forma basis) to such dividend no default or event of default under the Second A&R Credit Agreement has occurred and is continuing; provided that the amount such limit does not apply if our total net leverage ratio is less than or equal to 2.75 to 1.00 at the time of and immediately after giving effect (including giving effect on a pro forma basis) to such dividend.
Stock Performance Graph
The following graph compares the cumulative stockholder return on our common stock during the period from December 31, 2017 through December 31, 2022 with the cumulative return during the period for:
•the Nasdaq Composite Index (all companies traded on Nasdaq Capital, Global or Global Select Markets) and
•the 2022 Avid Peer Group Index (see details following the graph).
This comparison assumes the investment of $100 on December 31, 2017 in our common stock, the Nasdaq Market Index, and the Avid Peer Group Index, and assumes that dividends, if any, were reinvested.
24
COMPARISON OF FIVE-YEAR CUMULATIVE TOTAL RETURN
Among Avid Technology, Inc., the Nasdaq Composite Index,
and a Peer Group
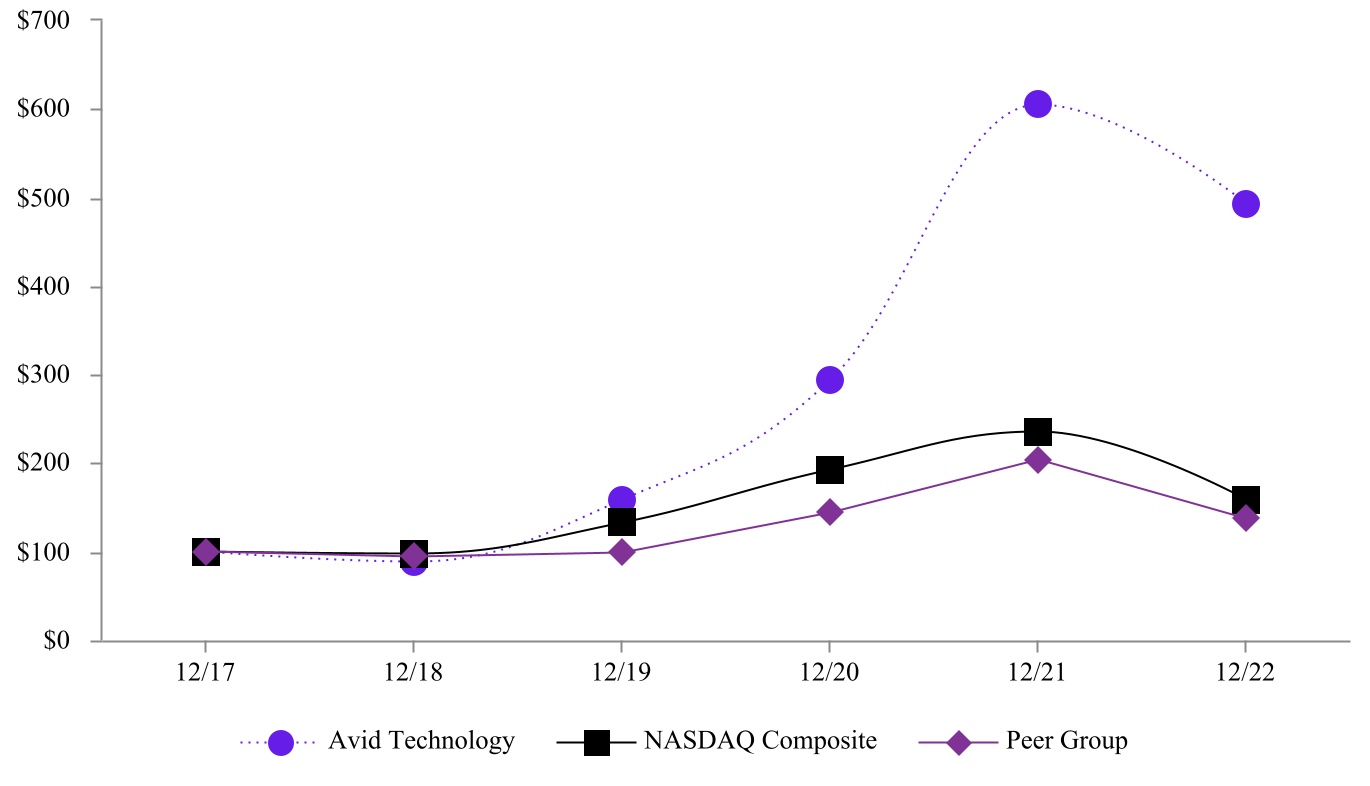
Because our products and services are diverse, we do not believe any single published industry index is appropriate for comparing stockholder return. As a result, we compare our common stock returns to a peer group index, which was composed of Nasdaq traded companies selected to best represent our peers based on various criteria, including industry classification, number of employees, and market capitalization.
The composition of the Avid Peer Group Index is dictated by the peer group selected by the compensation committee of our board of directors for reference in setting executive compensation. The compensation committee seeks generally to include companies with similar product and service offerings to those of Avid while also achieving a balance of smaller and larger sized peer companies in terms of market capitalizations and revenue.
The Avid Peer Group Index for 2022 was composed of: 3D Systems Corporation, A10 Networks Inc., Altair Engineering, Inc., Benefitfocus Inc., Box, Inc., Brightcove Inc., Calamp Corporation, Calix, Inc., Harmonic, Inc., IMAX Corporation, Edgio Inc., Microstrategy Inc., OneSpan Inc., Progress Software Corporation, Ribbon Communications Inc., Shutterstock, Inc.
The Avid Peer Group Index is weighted based on market capitalization.
25
Common Stock Repurchases
Share repurchase activity during the three months ended December 31, 2022 was as follows:
| Period | Total number of shares purchased | Average price paid per share | Total number of shares purchased as part of publicly announced programs | Maximum approximate dollar value of shares that may yet be purchased under the programs | ||||||||||||||||||||||
| October 1, 2022 - October 31, 2022 | 254,035 | $ | 25.30 | 254,035 | $ | 39,920,543 | ||||||||||||||||||||
| November 1, 2022 - November 30, 2022 | 11,322 | $ | 27.46 | 11,322 | $ | 39,609,679 | ||||||||||||||||||||
| December 1, 2022 - December 31, 2022 | 99,403 | $ | 25.58 | 99,403 | $ | 37,067,369 | ||||||||||||||||||||
On September 9, 2021, our board of directors approved the repurchase of up to $115.0 million of our outstanding shares. This authorization does not have a prescribed expiration date. As of December 31, 2022, approximately $37.1 million of the $115.0 million share repurchase authorization remained available. The Company has no obligation to repurchase any amount of its common stock, and the program may be suspended or discontinued at any time. For the year ended December 31, 2022 the Company repurchased 2,036,524 shares of its common stock for $52.8 million.
26
ITEM 6. RESERVED
27
ITEM 7.MANAGEMENT’S DISCUSSION AND ANALYSIS OF FINANCIAL CONDITION AND RESULTS OF OPERATIONS
EXECUTIVE OVERVIEW
Business Overview
We develop, market, sell, and support software and integrated solutions for video and audio content creation, management and distribution. We are a leading technology provider that powers the media and entertainment industry. We do this by providing an open and efficient platform for digital media, along with a comprehensive set of tools and workflow solutions. Our solutions are used in production and post-production facilities; film studios; network, affiliate, independent and cable television stations; recording studios; live-sound performance venues; advertising agencies; government and educational institutions; corporate communications departments; and by independent video and audio creative professionals, as well as aspiring professionals. Projects produced using our tools, platform, and ecosystem include feature films, television programming, live events, news broadcasts, sports productions, commercials, music, video, and other digital media content. With over one million creative users and thousands of enterprise clients relying on our technology platforms and solutions around the world, Avid enables the industry to thrive in today’s connected media and entertainment world.
Our mission is to empower media creators with innovative technology and collaborative tools to entertain, inform, educate, and enlighten the world. Our clients rely on Avid to create prestigious and award-winning feature films, music recordings, television shows, live concerts, sporting events, and news broadcasts. Avid has been honored for technological innovation with 18 Emmy Awards, one Grammy Award, two Oscars (Scientific and Technical Academy Awards of Merit), and the first ever America Cinema Editors Technical Excellence Award.
Operations Overview
Our strategy for connecting creative professionals and media enterprises with audiences in a powerful, efficient, collaborative, and profitable way leverages our creative software tools, including Pro Tools for audio and Media Composer for video, and our MediaCentral Platform - the open, extensible, and customizable foundation that streamlines and simplifies content workflows by integrating all Avid or third-party products and services that run on top of it. The platform provides secure and protected access, and enables fast and easy creation, delivery, and monetization of content. We work to ensure that we are meeting customer needs, staying ahead of industry trends, and investing in the right areas.
A key element of our strategy is our transition to a recurring revenue-based model through a combination of subscription offerings, maintenance contracts, and long-term agreements. We started offering subscription licensing options for some of our products and solutions in 2014 and by the end of 2022 we offered subscription licensing for all of our software solutions and we had approximately 506,000 paid subscriptions. Subscription count includes all paid and active seats under multi-seat licenses. These licensing options offer choices in pricing and deployment to suit our customers’ needs. We expect to increase subscription sales to media enterprises going forward as we expand offerings and move through customer upgrade cycles, which we expect will further increase recurring revenue on a longer-term basis. Our long-term agreements are comprised of multi-year agreements with large media enterprise customers to provide specified products and services, including SAAS offerings, and agreements with channel partners and resellers to purchase minimum amounts of products and service over a specified period of time.
Avid is committed to our digital transformation initiative, which focuses on optimizing systems, processes, and back-office functions with the objective of improving our operations related to our digital and subscription business. The initiative started in the third quarter of 2021, and is expected to continue through 2024. We plan to significantly invest in transforming our enterprise-wide infrastructure and technologies to benefit customers and drive enhanced performance across the company.
28
CRITICAL ACCOUNTING ESTIMATES
Our consolidated financial statements have been prepared in accordance with GAAP. The preparation of these financial statements requires us to make estimates and assumptions that affect the reported amounts of assets and liabilities and the disclosures of contingent assets and liabilities as of the date of the financial statements, and the reported amounts of revenues and expenses during the reporting period. We regularly reevaluate our estimates and judgments, including those related to the following: revenue recognition and allowances for sales returns and exchanges and income tax assets and liabilities. We base our estimates and judgments on historical experience and various other factors we believe to be reasonable under the circumstances, the results of which form the basis for judgments about the carrying values of assets and liabilities and the amounts of revenues and expenses that are not readily apparent from other sources. Actual results may differ from these estimates.
We believe the following critical accounting estimates most significantly affect the portrayal of our financial condition and involve our most difficult and subjective estimates and judgments.
Revenue Recognition
We often enter into contractual arrangements that have multiple performance obligations, one or more of which may be delivered subsequent to the delivery of other performance obligations. These arrangements may include a combination of products, maintenance, training, and professional services. We allocate the transaction price of the arrangement based on the relative estimated standalone selling price, or SSP, of each distinct performance obligation.
Our process for determining SSP for each performance obligation involves significant management judgment. In determining SSP, we maximize observable inputs and consider a number of data points, including:
• the pricing of standalone sales (in the limited instances where available);
• the pricing established by management when setting prices for deliverables that are intended to be sold on a standalone
basis;
• contractually stated prices for deliverables that are intended to be sold on a standalone basis;
• other pricing factors, such as the geographical region in which the products are sold and expected discounts based on
the customer size and type.
Determining SSP for performance obligations which we never sell separately also requires significant judgment. In estimating the SSP in these circumstances, we consider the likely price that would have resulted from established pricing practices had the deliverable been offered separately and the prices a customer would likely be willing to pay.
We only include estimated amounts in the transaction price to the extent it is probable that a significant reversal of cumulative revenue recognized will not occur when the uncertainty associated with the variable consideration is resolved. We reduce transaction prices for estimated returns and other allowances that represent variable consideration under ASC 606, which we estimate based on historical return experience and other relevant factors, and we record a corresponding refund liability as a component of accrued expenses and other current liabilities. Other forms of contingent revenue or variable consideration are infrequent.
Income Tax Assets and Liabilities
We record deferred tax assets and liabilities based on the net tax effects of tax credits, operating loss carryforwards, and temporary differences between the carrying amounts of assets and liabilities for financial reporting purposes compared to the amounts used for income tax purposes. We regularly review our deferred tax assets for recoverability with consideration for such factors as historical losses, projected future taxable income, and the expected timing of the reversals of existing temporary differences. A valuation allowance is recorded when it is more likely than not that some portion or all of the deferred tax assets will not be realized.
Management believes the U.S deferred tax assets, based largely on the history of U.S. tax losses, warrant a full valuation allowance based on the weight of available negative evidence. We also determined that a full valuation allowance is warranted on a portion of our foreign deferred tax assets.
29
Our assessment of the valuation allowance on our U.S. and foreign deferred tax assets could change in the future based on our levels of pre-tax income and other tax-related adjustments. Reversal of the valuation allowance in whole or in part would result in a non-cash reduction in income tax expense during the period of reversal. To the extent some or all of our valuation allowance is reversed, future financial statements would reflect an increase in non-cash income tax expense until such time as our deferred tax assets are fully utilized.
We account for uncertainty in income taxes recognized in our financial statements by applying a two-step process to determine the amount of tax provision or benefit to be recognized. First, the tax position must be evaluated to determine the likelihood that it will be sustained upon examination by the taxing authorities based on the technical merits of the position. If the tax position is deemed more likely than not to be sustained, the tax position is then assessed to determine the amount of provision or benefit to recognize in the financial statements. The amount of provision or benefit that may be recognized is the largest amount that has a greater than 50% likelihood of being realized upon ultimate settlement. Our provision for income taxes includes the effects of any resulting tax reserves, referred to as unrecognized tax benefits, that are considered appropriate as well as the related net interest and penalties.
RESULTS OF OPERATIONS
Management's Discussion and Analysis of Financial Condition and Results of Operations (“MD&A”) provides narrative from the perspective of our management on our financial condition, results of operations, liquidity and certain other factors that may affect our future results. Our MD&A should be read in conjunction with the Consolidated Financial Statements and related Notes included in Item 8, Financial Statements and Supplementary Data, of this Annual Report on Form 10-K. Refer to Item 7, Management’s Discussion and Analysis of Financial Condition and Results of Operations, in our Form 10-K for the fiscal year ended December 31, 2021, for discussion of the results of operations for the year ended December 31, 2021, compared to the year ended December 31, 2020, which is incorporated by reference herein.
Recent Developments Affecting Our Business
Our business and financial performance depend significantly on worldwide economic conditions. We face global macroeconomic challenges, particularly in light of the effects of the ongoing geopolitical conflicts in Ukraine, the COVID-19 pandemic, uncertainty in the markets, volatility in exchange rates, inflationary trends and evolving dynamics in the global trade environment. Throughout 2022, we observed significant market uncertainty, increasing inflationary pressures, supply constraints and a strengthening U.S. dollar. We continue to manage through supply constraints seen industry-wide due to component shortages, and for which the duration of such constraints is uncertain. These shortages have resulted in increased costs (i.e., component and other commodity costs, freight, expedite fees, etc.) which have had a negative impact on our product gross margin and have resulted in extended lead times for us and our customers.
As a company with an extensive global footprint, we are subject to risks and exposures from foreign currency exchange rate fluctuations caused by significant events with macroeconomic impacts. We continuously monitor the direct and indirect impacts of these circumstances on our business and financial results, as well as the overall global economy and geopolitical landscape. Foreign currency exchange rate fluctuations negatively impacted our revenue and earnings during 2022.
While our revenue and earnings are relatively predictable as a result of our subscription-based business model, the broader implications of these macroeconomic events on our business, results of operations and overall financial position, particularly in the long term, remain uncertain. See the section titled “Risk Factors” in Part I, Item 1A of this report for further discussion of the possible impact of these macroeconomic issues on our business.
On August 16, 2022, the U.S. government enacted the Inflation Reduction Act of 2022 (the "Inflation Reduction Act") into law. the Inflation Reduction Act imposes an excise tax of 1% tax on the fair market value of net stock repurchases made after December 31, 2022. The impact of this provision will be dependent on the extent of share repurchases made in future periods. We continue to analyze the impacts of the Inflation Reduction Act; however, it is not expected to have a material impact on our financial statements. Additionally, the Inflation Reduction Act includes a new corporate alternative minimum tax which is not currently applicable to the Company.
30
The following table sets forth certain items from our consolidated statements of operations as a percentage of net revenues for the periods indicated:
| Year Ended December 31, | |||||||||||||||||
| 2022 | 2021 | 2020 | |||||||||||||||
| Net revenues: | |||||||||||||||||
| Subscription revenues | 36.3 | % | 26.4 | % | 20.2 | % | |||||||||||
| Maintenance revenues | 26.3 | % | 29.9 | % | 34.4 | % | |||||||||||
| Integrated solutions revenue | 37.4 | % | 43.7 | % | 45.4 | % | |||||||||||
| Total net revenues | 100.0 | % | 100.0 | % | 100.0 | % | |||||||||||
| Cost of revenues | 34.3 | % | 35.2 | % | 36.7 | % | |||||||||||
| Gross margin | 65.7 | % | 64.8 | % | 63.3 | % | |||||||||||
| Operating expenses: | |||||||||||||||||
| Research and development | 16.0 | % | 16.0 | % | 15.8 | % | |||||||||||
| Marketing and selling | 23.0 | % | 23.2 | % | 24.3 | % | |||||||||||
| General and administrative | 13.7 | % | 14.0 | % | 13.0 | % | |||||||||||
| Restructuring costs, net | 0.1 | % | 0.3 | % | 1.4 | % | |||||||||||
| Total operating expenses | 52.8 | % | 53.5 | % | 54.5 | % | |||||||||||
| Operating income | 12.9 | % | 11.3 | % | 8.8 | % | |||||||||||
| Interest and other expense, net | (2.0) | % | (0.6) | % | (5.3) | % | |||||||||||
| Income before income taxes | 10.9 | % | 10.7 | % | 3.5 | % | |||||||||||
| Benefit from (provision for) income taxes | (2.4) | % | 0.6 | % | 0.4 | % | |||||||||||
| Net income | 13.3 | % | 10.1 | % | 3.1 | % | |||||||||||
A summary of our revenue sources for the years ended December 31, 2022, 2021 and 2020 respectively, is as follows (in thousands):
| Year Ended December 31, | |||||||||||||||||
| 2022 | 2021 | 2020 | |||||||||||||||
| Subscriptions | $ | 151,330 | $ | 108,443 | $ | 72,831 | |||||||||||
| Maintenance | 109,845 | 122,411 | 124,175 | ||||||||||||||
| Subscriptions and Maintenance | 261,175 | 230,854 | 197,006 | ||||||||||||||
| Perpetual Licenses | 11,091 | 23,793 | 27,858 | ||||||||||||||
| Software Licenses and Maintenance | 272,266 | 254,647 | 224,864 | ||||||||||||||
| Integrated Solutions | 123,277 | 131,073 | 112,904 | ||||||||||||||
| Professional Services and Training | 21,870 | 24,224 | 22,698 | ||||||||||||||
| Total Revenue | $ | 417,413 | $ | 409,944 | $ | 360,466 | |||||||||||
Net Revenues
Our net revenues are derived mainly from sales of subscription software solutions, maintenance contracts, and integrated solutions for digital media content production, management and distribution, and related professional services. We commonly sell large, complex solutions to our customers that, due to their strategic nature, have long lead times where the timing of order execution and fulfillment can be difficult to predict. In addition, the rapid evolution of the media industry is changing our customers’ needs,
31
businesses, and revenue models, which is influencing their short-term and long-term purchasing decisions. As a result of these factors, the timing and amount of product revenue recognized related to orders for large, complex solutions, as well as the services associated with them, can fluctuate from quarter to quarter and cause significant volatility in our quarterly and annual operating results. See the risk factors discussed in Part I - Item 1A under the heading “Risk Factors” of this Form 10-K.
Avid has now completed the allocation of transaction price for 2022 using an updated SSP methodology that includes consideration of the effect of multi-year customer contracts, and, as a result has recorded a negative adjustment of $3.3 million in the quarter ended December 31, 2022, consisting of $1.3 million related to fiscal year 2022, $2.1 million related to fiscal year 2021, and a benefit of $0.1 million related to fiscal year 2020, to account for the cumulative impact of these multi-year term customer contracts since the quarter ended December 31, 2020. This adjustment represents 0.3% of cumulative revenue during the three fiscal years ended December 31, 2022, and represents 2.9% of revenue for the quarter ended December 31, 2022.
Net Revenues for the Years Ended December 31, 2022 and 2021 | |||||||||||||||||||||||
| (dollars in thousands) | |||||||||||||||||||||||
| 2022 | Change | 2021 | |||||||||||||||||||||
| Net Revenues | $ | % | Net Revenues | ||||||||||||||||||||
| Subscription | $ | 151,330 | $ | 42,887 | 39.5% | $ | 108,443 | ||||||||||||||||
| Maintenance | 109,845 | (12,566) | (10.3)% | 122,411 | |||||||||||||||||||
| Integrated solutions & other | 156,238 | (22,852) | (12.8)% | 179,090 | |||||||||||||||||||
| Total net revenues | $ | 417,413 | $ | 7,469 | 1.8% | $ | 409,944 | ||||||||||||||||
The following table sets forth the percentage of our net revenues attributable to geographic regions for the periods indicated:
| Year Ended December 31, | |||||||||||||||||
| 2022 | 2021 | 2020 | |||||||||||||||
| United States | 43% | 42% | 40% | ||||||||||||||
| Other Americas | 7% | 5% | 7% | ||||||||||||||
| Europe, Middle East and Africa | 36% | 39% | 39% | ||||||||||||||
| Asia-Pacific | 14% | 14% | 14% | ||||||||||||||
Subscription Revenue
Subscription revenues have continued increasing year over year, in line with expectations, as a result of new customers adopting our solutions, customers transitioning from our perpetual product licenses to our subscription-based model and our offering subscription licensing options for more of our software solutions. The Company anticipates this trend to continue throughout the next few years as we continue to add new customers and transition to subscription and SAAS based solutions for more of our offerings. Subscription revenue in 2022 was impacted by the $3.3 million reduction in revenue as a result of the adjustment noted above.
Maintenance Revenue
Our maintenance revenues are derived from a variety of maintenance contracts for our software and integrated solutions. Maintenance contracts allow each customer to select the level of technical and operational support that they need to maintain their operational effectiveness. Maintenance contracts typically include the right to the latest software updates, call support, and, in some cases, hardware maintenance. We expect maintenance revenues to decrease in the coming years as customers who are on maintenance contracts continue to migrate to our subscription and SAAS based solutions offset in part by customers with perpetual licenses continue to renew their maintenance contracts. Additionally, during 2022, maintenance revenue declined by $12.6 million from the prior year, primarily due to lower maintenance revenue related to new integrated solutions sales; this was caused by delayed integrated solutions shipments as a result of supply chain issues.
32
Integrated Solutions and other Revenues
Integrated solutions and other revenues decreased as a result of delayed shipments due to supply chain issues as well as customers transitioning from our perpetual product licenses to our subscription-based model.
Revenue Backlog
At December 31, 2022, we had revenue backlog of approximately $382.8 million, of which approximately $223.9 million is expected to be recognized in the next 12 months, compared to $412.8 million of revenue backlog at December 31, 2021. Revenue backlog, as we define it, consists of firm orders received and includes both (i) orders where the customer has paid in advance of our performance obligations being fulfilled, and (ii) orders for future product deliveries or services that have not yet been invoiced by us. Revenue backlog associated with arrangement consideration paid in advance primarily consists of deferred revenue related to (i) the undelivered portion of annual maintenance contracts and (ii) Implied Maintenance Release PCS performance obligations. See Note P, Revenue, to our Consolidated Financial Statements in Item 8 of the Form 10-K for a description of implied performance obligation of a form of post-contract maintenance support (“Implied Maintenance Release PCS”). Revenue backlog associated with orders for future product deliveries and services where cash has not been received primarily consists of (i) product orders received but not yet shipped, (ii) professional services not yet rendered, and (iii) future years of multi-year maintenance agreements not yet billed. Our definition of backlog includes contractual commitments with customers that specify minimum future purchases, however, since these contractual arrangements do not specify which specific products and services must be purchased to fulfill these commitments, they do not meet the definition of an unfulfilled remaining performance obligation under GAAP.
Orders included in revenue backlog may be reduced, canceled, or deferred by our customers. The expected timing of the recognition of revenue backlog as revenue is based on our current estimates and could change based on a number of factors, including (i) the timing of delivery of products and services, (ii) customer cancellations or change orders, or (iii) changes in the estimated period of time Implied Maintenance Release PCS is provided to customers. As there is no industry standard definition of revenue backlog, our reported revenue backlog may not be comparable with other companies. Revenue backlog as of any particular date should not be relied upon as indicative of our net revenues for any future period.
Cost of Revenues, Gross Profit, and Gross Margin Percentage
Cost of revenues consists primarily of costs associated with:
•procurement of components and finished goods;
•assembly, testing, and distribution of finished goods;
•warehousing;
•customer support related to maintenance;
•royalties for third-party software and hardware included in our products; and
•providing professional services and training for customers.
Costs of Revenues for the Years Ended December 31, 2022 and 2021 | |||||||||||||||||||||||
| (dollars in thousands) | |||||||||||||||||||||||
| 2022 | Change | 2021 | |||||||||||||||||||||
| Costs | $ | % | Costs | ||||||||||||||||||||
| Subscription | $ | 23,504 | $ | 8,541 | 57.1% | $ | 14,963 | ||||||||||||||||
| Maintenance | 19,913 | (3,068) | (13.4)% | 22,981 | |||||||||||||||||||
| Integrated solutions & other | 99,558 | (6,638) | (6.3)% | 106,196 | |||||||||||||||||||
| Total cost of revenues | $ | 142,975 | $ | (1,165) | (0.8)% | $ | 144,140 | ||||||||||||||||
| Gross profit | $ | 274,438 | $ | 8,634 | 3.2% | $ | 265,804 | ||||||||||||||||
33
Gross Margin Percentage
Gross margin percentage, which is net revenues less costs of revenues divided by net revenues, fluctuates based on factors such as the mix of products sold, the cost and proportion of third-party hardware and software included in the systems sold, the offering of product upgrades, price discounts and other sales-promotion programs, the distribution channels through which products are sold, the timing of new product introductions, sales of aftermarket hardware products such as disk drives, and currency exchange-rate fluctuations.
Gross Margin % for the Years Ended December 31, 2022 and 2021 | |||||||||||||||||
2022 Gross Margin % | (Decrease) Increase in Gross Margin % | 2021 Gross Margin % | |||||||||||||||
| Subscription | 84.5% | (1.7)% | 86.2% | ||||||||||||||
| Maintenance | 81.9% | 0.7% | 81.2% | ||||||||||||||
| Integrated solutions & other | 36.3% | (4.4)% | 40.7% | ||||||||||||||
| Total Gross Margin | 65.7% | 0.9% | 64.8% | ||||||||||||||
Subscription gross margin decreased in 2022 due to increased customer care costs being allocated to subscription as well as the $3.3 million reduction in revenue as a result of the adjustment noted above. The margin for integrated solutions decreased as a result of supply chain issues in 2022. The total gross margin improved due to the increased volume on our higher margin subscription revenue.
Operating Expenses and Operating Income
Operating Expenses and Operating Income for the Years Ended December 31, 2022 and 2021 | |||||||||||||||||||||||
| (dollars in thousands) | |||||||||||||||||||||||
| 2022 | Change | 2021 | |||||||||||||||||||||
| Expenses | $ | % | Expenses | ||||||||||||||||||||
| Research and development expenses | $ | 66,904 | $ | 1,345 | 2.1% | $ | 65,559 | ||||||||||||||||
| Marketing and selling expenses | 95,977 | 483 | 0.5% | 95,494 | |||||||||||||||||||
| General and administrative expenses | 57,189 | (183) | (0.3)% | 57,372 | |||||||||||||||||||
| Restructuring costs, net | 513 | (603) | (54.0)% | 1,116 | |||||||||||||||||||
| Total operating expenses | $ | 220,583 | $ | 1,042 | 0.5% | $ | 219,541 | ||||||||||||||||
| Operating income | $ | 53,855 | $ | 7,592 | 16.4% | $ | 46,263 | ||||||||||||||||
Research and Development Expenses
Research and development, or R&D, expenses include costs associated with the development of new products and the enhancement of existing products, and consist primarily of employee salaries and benefits, facilities costs, depreciation, costs for consulting and temporary employees, and prototype and other development expenses. The table below provides further details regarding the changes in components of R&D expense.
34
Year-Over-Year Change in R&D Expenses for the Year Ended December 31, 2022 | |||||||||||
| (dollars in thousands) | |||||||||||
2022 Increase/(Decrease) From 2021 | |||||||||||
| $ | % | ||||||||||
| Consulting and outside services expenses | $ | 2,654 | 27.1% | ||||||||
| Facilities and information technology expenses | (600) | (4.8)% | |||||||||
| Personnel and other expenses | (388) | (0.9)% | |||||||||
| Computer hardware and supplies expenses | (321) | (19.9)% | |||||||||
| Total research and development expenses change | $ | 1,345 | 2.1% | ||||||||
The increase in consulting and outside services was primarily due to both an increase in fees as well as increased usage of contractors. The decrease in facilities and information technology expenses is largely due to a decrease in headcount in our R&D departments, which resulted in lower allocated expenses to the R&D department. This decrease is partially offset by the increased spend on our information technology infrastructure to support ongoing business operations.
Marketing and Selling Expenses
Marketing and selling expenses consist primarily of employee salaries and benefits for selling, marketing, and pre-sales customer support personnel, commissions, travel expenses, advertising and promotional expenses, web design costs, and facilities costs. The table below provides further details regarding the changes in components of marketing and selling expense.
Year-Over-Year Change in Marketing and Selling Expenses for Year Ended December 31, 2022 | ||||||||||||||
| (dollars in thousands) | ||||||||||||||
2022 Increase/(Decrease) From 2021 | ||||||||||||||
| $ | % | |||||||||||||
| Advertising and marketing | 688 | 31.5% | ||||||||||||
| Consulting and other expenses | (522) | (5.7)% | ||||||||||||
| Facilities and information technology expenses | 444 | 2.9% | ||||||||||||
| Personnel-related expenses | $ | (245) | (0.4)% | |||||||||||
| Foreign exchange translations | 118 | 9.2% | ||||||||||||
| Total marketing and selling expenses change | $ | 483 | 0.5% | |||||||||||
The increase in advertising and marketing was primarily due to the resumption of in-person trade shows and events that were attended remotely in the prior year. The decrease in consulting and other expenses was primarily due to consulting work performed in 2021 around our digital transformation initiative focused on building an overall framework for design implementations. The increase in facilities and information technology expenses was related to increased spend on our information technology infrastructure to support ongoing business operations. The decrease in personnel-related expenses was primarily the result of a decrease in variable related compensation. The increase in foreign exchange translations was due to foreign exchange gains and losses from foreign currency denominated transactions and the revaluation of foreign currency denominated assets and liabilities. These foreign exchange changes were primarily due to the euro-dollar and pound-dollar exchange rate volatility.
General and Administrative Expenses
General and administrative, or G&A, expenses consist primarily of employee salaries and benefits for administrative, executive, finance, and legal personnel, audit, legal, and strategic consulting fees, and insurance, information systems, and facilities costs. The table below provides further details regarding the changes in components of G&A expense.
35
Year-Over-Year Change in G&A Expenses for the Year Ended December 31, 2022 | |||||||||||
| (dollars in thousands) | |||||||||||
2022 Increase/(Decrease) From 2021 | |||||||||||
| $ | % | ||||||||||
| Other expenses | (693) | (1.9)% | |||||||||
| Facilities and information technology expenses | 613 | 10.0% | |||||||||
| Consulting and outside services expenses | (103) | (0.7)% | |||||||||
| Total general and administrative expenses change | $ | (183) | (0.3)% | ||||||||
The decrease in other expenses was primarily a result of reduced business development activities in 2022. The increase in facilities and information technology expenses was related to increased spend on our information technology infrastructure to support ongoing business operations.
Restructuring Costs, Net
In October 2020, we committed to a restructuring plan in order to reorganize the business to better support the company’s strategy and overall performance. This restructuring plan was complete as of December 31, 2022.
During the year ended December 31, 2022, we recorded $0.5 million of severance costs for three positions that were eliminated during 2022.
During the year ended December 31, 2021, we recorded $1.1 million of severance costs for 24 positions that were eliminated during 2021.
Interest and Other Income, Net
Interest and Other Income, net for the Years Ended December 31, 2022 and 2021 | |||||||||||||||||||||||
| (dollars in thousands) | |||||||||||||||||||||||
| 2022 | Change | 2021 | |||||||||||||||||||||
| Income (Expense) | $ | % | Income (Expense) | ||||||||||||||||||||
| Interest income | $ | 45 | $ | 39 | 650.0% | $ | 6 | ||||||||||||||||
| Interest expense | (9,395) | (2,240) | 31.3% | (7,155) | |||||||||||||||||||
| Other income, net | 832 | (4,009) | (82.8)% | 4,841 | |||||||||||||||||||
| Total interest and other income, net | $ | (8,518) | $ | (6,210) | 269.1% | $ | (2,308) | ||||||||||||||||
The increase in interest expense was due to a higher interest rate as a result of increases in the Secured Overnight Financing Rate (SOFR) on our borrowings and a higher level of borrowings, offset in part by lower interest rate margin on our borrowings. See Note Q, Long-Term Debt and Credit Agreement, to our Consolidated Financial Statements in Item 8 of this Form 10-K for further information. Other income, net in 2021 included the gain on the forgiveness of our PPP loan offset by the loss due to extinguishment of debt.
36
(Benefit from) Provision for Income Taxes
(Benefit from) Provision for Income Taxes for the Years Ended December 31, 2022 and 2021 | |||||||||||||||||||||||
| (dollars in thousands) | |||||||||||||||||||||||
| 2022 | Change | 2021 | |||||||||||||||||||||
| Provision | $ | % | Provision | ||||||||||||||||||||
| (Benefit from) Provision for income taxes | $ | (9,904) | $ | (12,471) | (485.8)% | $ | 2,567 | ||||||||||||||||
Our effective tax rate, which represents our tax provision as a percentage of income before tax, was (21.8)% and 5.8% respectively, for 2022 and 2021.
The decrease in our 2022 provision was primarily driven by an $11.3 million non-recurring benefit from the release of a reserve for an uncertain tax position in our German subsidiary due to the expiration of a related statute of limitations augmented by $0.7 million due to a windfall deduction related to stock based compensation in our UK subsidiary.
We have significant accumulated deferred tax assets including the tax effects of net operating losses and tax credit carryovers. The realization of the net deferred tax assets is dependent upon the generation of sufficient future taxable income in the applicable tax jurisdictions. We regularly review our deferred tax assets for recoverability with consideration for such factors as historical losses, projected future taxable income, the expected timing of the reversals of existing temporary differences, and tax planning strategies. ASC Topic 740, Income Taxes, requires us to record a valuation allowance when it is more likely than not that some portion or all of the deferred tax assets will not be realized. Management believes the remaining deferred tax assets, based largely on the long history of U.S. tax losses, warrant a valuation allowance based on the weight of available negative evidence. We have also determined that a full valuation allowance is warranted on a portion of our foreign deferred tax assets. We have experienced recent profitability in the U.S.; however we intend to continue maintaining a full valuation allowance on our U.S. deferred tax assets until there is sufficient positive evidence to allow us to reach a conclusion that a significant portion of the valuation allowance will no longer be needed. Any such release of the valuation allowance, or a portion thereof, would result in a material non-cash income tax benefit in the quarter the realizability of the respective deferred taxes were deemed to be more likely than not and would increase non-cash income tax expense in the periods subsequent to the reversal.
37
LIQUIDITY AND CAPITAL RESOURCES
Liquidity and Sources of Cash
Our principal source of liquidity is cash and cash equivalents, which totaled $35.2 million as of December 31, 2022. We have generally funded operations in recent years through the use of existing cash balances, supplemented from time to time with the proceeds of long-term debt and borrowings under our credit facilities.
Our cash requirements vary depending on factors such as the growth of the business, changes in working capital, and capital expenditures. We expect to operate the business and execute our strategic initiatives principally with funds generated from operations, remaining net proceeds from the term loan borrowings under the Second Amended and Restated Credit Agreement (“Second A&R Credit Agreement”), and draws of up to a maximum of $120.0 million under the Second A&R Credit Agreement’s revolving credit facility described below. We anticipate that we will have sufficient internal and external sources of liquidity to fund operations and anticipated working capital and other expected cash needs for at least the next 12 months from the filing of our annual report as well as for the foreseeable future. Refer to the contractual obligations discussion below, for our anticipated cash requirements related to contractual obligations.
In year ended December 31, 2021, we committed to a digital transformation initiative focused around modernizing our enterprise-wide infrastructure and technologies to benefit our customers and drive enhanced performance across the company. Over the next three years, we plan to invest significant funds and resources towards implementing these new technologies as part of this initiative. These expenditures will be a mix of capital expenditures which will flow through our investing operations as well as SAAS based software solutions which will increase our use of cash from operations.
Credit Agreement
On January 5, 2021, we entered into the Credit Agreement with JPMorgan Chase Bank, N.A., as the administrative agent, or the Agent, and the lenders party thereto, or the Lenders. Pursuant to the Credit Agreement, the Lenders agreed to provide us with (a) a term loan in the aggregate principal amount of $180.0 million, (or the “Term Loan”) and (b) a revolving credit facility of up to a maximum of $70.0 million in borrowings outstanding at any time, (the “Revolving Credit Facility”). We borrowed the full amount of the $180.0 million Term Loan on the closing date, but did not borrow any amount under the Revolving Credit Facility on the closing date. The borrowings under the Term Loan and cash on hand were used to repay outstanding borrowings under the Company’s prior financing agreement with Cerberus Business Finance, LLC, which was then terminated. Prior to the maturity of the Revolving Credit Facility, any amounts borrowed under the Revolving Credit Facility could be repaid and, subject to the terms and conditions of the Credit Agreement, reborrowed in whole or in part without penalty.
On February 25, 2022, the Company executed an Amended and Restated Credit Agreement (the “A&R Credit Agreement”) with JPMorgan Chase Bank, N.A. and the Lenders. The A&R Credit Agreement extended the term of the Term Loan by approximately one year to February 25, 2027, reduced the applicable interest rate margins by 0.25%, removed the LIBOR floor, moved the reference rate from LIBOR to SOFR, reset the principal amortization schedule, and eliminated the fixed charge coverage ratio. The A&R Credit Agreement contained a financial covenant to maintain a total net leverage ratio of no more than 4.00 to 1.00 initially, with step downs thereafter. Other terms of the A&R Credit Agreement remained substantially the same as the Credit Agreement. The Term Loan, as amended, had an initial interest rate of SOFR plus a 0.10% credit spread adjustment plus an applicable margin of 2.25%, with a 0% floor. The applicable margin for SOFR loans under the A&R Credit Agreement ranged from 1.75% to 3.0%, depending on the Company’s total net leverage ratio. Both the Term Loan and the Revolving Credit Facility would mature on February 25, 2027 under the A&R Credit Agreement.
On October 6, 2022, the Company executed the Second Amended and Restated Credit Agreement (the “Second A&R Credit Agreement”) with JPMorgan Chase Bank, N.A. and the Lenders. Pursuant to the Second A&R Credit Agreement, the Lenders agreed to provide the Company with (a) an additional term loan in the aggregate principal amount of $20 million (of which approximately $19 million was used to pay off the Company’s outstanding drawings under the Revolving Credit Facility), and (b) an additional $50 million of available borrowing capacity under the Revolving Credit Facility, increasing the aggregate amount available to $120.0 million. The Second A&R Credit Agreement, amends and restates the Company’s existing A&R Credit Agreement, includes substantially similar terms and does not result in any changes to financial covenants, pricing or the maturity date of February 25, 2027.
38
Financial terms and prepayments. Under the Second A&R Credit Agreement, interest accrues on outstanding borrowings under the Term Loan and the Revolving Credit Facility at a rate of the Alternate Base Rate, Adjusted Term SOFR Rate, the Adjusted EURIBO Rate, Adjusted TIBO Rate pr Adjusted Daily Simple RFR (each as defined in the Second A&R Credit Agreement), at the option of the Company, plus a spread of 0.75% to 2.00% with no floor with respect to the Alternate Base Rate, and a spread of 1.75% to 3.00% with no floor with respect to the Adjusted Term SOFR Rate, the Adjusted EUROIBO Rate, the Adjusted TIBO Rate or the Adjusted Daily Simple RFR, in each case depending on our total net leverage ratio. In addition, we have to pay the Lenders, on a quarterly basis, a commitment fee at a rate of 0.20% to 0.50%, depending on our leverage ratio, on the average daily amount equal to (1) the total revolving commitments under the Revolving Credit Facility less (2) total amount of the outstanding borrowings under the Revolving Credit Facility during the immediately preceding three month period. During the term of the Revolving Credit Facility, we are entitled to reduce the maximum amounts of the Lenders’ commitments under the Revolving Credit Facility. We are also able to prepay all or any portion of the borrowings under the Second A&R Credit Agreement on or prior to the stated maturity, subject to the payment of certain break funding amounts, if applicable. In addition, subject to exceptions we are required to prepay the Term Loan with proceeds we receive from specified events, including sales of assets, insurance proceeds and condemnation awards and the incurrence of certain indebtedness. The Term Loan requires quarterly principal payments equal to $2,387,500 from March 31, 2023 through March 31, 2024, $3,581,250 from June 30, 2024 through March 31, 2025, and $4,775,000 on June 30, 2025 and on the last day of each calendar quarter thereafter, with the remaining aggregate principal amount due at maturity.
Collateral and guarantees. We and our subsidiary, Avid Technology Worldwide, Inc., or Avid Worldwide, granted a security interest in substantially all of our assets to secure the obligations of all obligors under the Term Loan and the Revolving Credit Facility. Avid Worldwide provided a guarantee of all our obligations under the Second A&R Credit Agreement. Our future subsidiaries (other than foreign subsidiaries and certain immaterial subsidiaries) are also required to become a party to the applicable security agreements and guarantee the obligations under the Second A&R Credit Agreement.
Representations and restrictive covenants. The Second A&R Credit Agreement contains representations, warranties and restrictive covenants that are customary for an agreement of that kind, including, for example, covenants that limited or restricted us from incurring additional indebtedness, granting liens, making investments and restricted payments, making acquisitions, entering into swap agreements, paying dividends, making payments of or amending the terms of certain subordinated indebtedness, engaging in sale and leaseback transactions, and engaging in transactions with affiliates.
Events of default. The Second A&R Credit Agreement contains customary events of default under which our payment obligations could be accelerated. These events of default include, among others, failure to pay amounts payable under the Second A&R Credit Agreement when due, breach of representations and warranties, failure to perform covenants, a change of control, default or acceleration of material indebtedness, certain judgments and certain impairments to the collateral.
Financial covenants. The Company is required to maintain a maximum total net leverage ratio, generally defined as the ratio of (x) consolidated total indebtedness minus liquidity maintained in the United States up to $25 million as of the end of each fiscal quarter to (y) consolidated EBITDA for the period of four consecutive fiscal quarters ending as of such date, not to exceed 3.75 to 1:00 as of the end of the fiscal quarters ending September 30, 2022 through December 31, 2022; 3.50 to 1.00 as of the end of the fiscal quarters ending March 31, 2023 through June 30, 2023; 3.25 to 1.00 as of the end of the fiscal quarters ending September 30, 2023 through December 31, 2023; and 3.00 to 1.00 as of the end of fiscal quarters ending on or after March 31, 2024.
Our ability to satisfy the maximum total net leverage ratio covenant in the future depends on our ability to maintain profitability and cash flow in line with prior results. This includes our ability to maintain bookings and billings in line with levels experienced over the last 12 months. In recent quarters, we have experienced volatility in bookings and billings resulting from, among other things, (i) our transition towards subscription and recurring revenue streams and the resulting decline in traditional upfront product sales, (ii) the rapid evolution of the media industry resulting in changes to our customers’ needs, (iii) the impact of new and anticipated product launches and features, and (iv) volatility in currency rates.
In the event revenues in future quarters are lower than we currently anticipate, we may be forced to take remedial actions which could include, among other things (and where allowed by the lenders), (i) further cost reductions, (ii) seeking replacement financing, (iii) raising funds through the issuance of additional equity or debt securities or the incurrence of additional borrowings, or (iv) disposing of certain assets or businesses. Such remedial actions, which may not be available on favorable terms or at all, could have a material adverse impact on our business. If we are not in compliance with the net leverage ratio covenant and are unable to obtain an amendment or waiver, such noncompliance may result in an event of default under the Second A&R Credit Agreement, which could permit acceleration of the outstanding indebtedness under the Second A&R Credit
39
Agreement and require us to repay such indebtedness before the scheduled due date. If an event of default were to occur, we might not have sufficient funds available to make the payments required. If we are unable to repay amounts owed, the lenders may be entitled to foreclose on and sell substantially all of our assets, which secure our borrowings under the Second A&R Credit Agreement.
Cash Flows
The following table summarizes our cash flows for the years ended December 31, 2022, 2021, and 2020 (in thousands):
| Year Ended December 31, | |||||||||||||||||
| 2022 | 2021 | 2020 | |||||||||||||||
| Net cash provided by operating activities | $ | 48,019 | $ | 62,489 | $ | 39,555 | |||||||||||
| Net cash used in investing activities | (15,251) | (6,819) | (5,692) | ||||||||||||||
| Net cash used in financing activities | (52,700) | (77,735) | (24,549) | ||||||||||||||
| Effect of foreign currency exchange rates on cash and cash equivalents | (1,772) | (1,016) | 1,748 | ||||||||||||||
| Net (decrease) increase in cash, cash equivalents and restricted cash | $ | (21,704) | $ | (23,081) | $ | 11,062 | |||||||||||
Cash Flows from Operating Activities
Cash provided by operating activities aggregated $48.0 million for the year ended December 31, 2022. The decrease compared to the prior year was primarily due to a change in working capital. Our contract assets increased as a result of growth in subscription licensing of our enterprise software solutions, with certain agreements having multi-year term.
Cash Flows from Investing Activities
For the year ended December 31, 2022, the net cash flow used in investing activities reflected $15.3 million used for the purchase of property and equipment. Our purchases of property and equipment largely consist of computer hardware and software to support R&D activities, and leasehold improvements. In addition, in 2022 we increased spending on the development of internal-use software as we upgrade and improve our back-office applications, as well as development of our cloud related infrastructure.
Cash Flows from Financing Activities
For the year ended December 31, 2022, net cash flows used in financing activities were primarily the result of our stock repurchase program and our common stock repurchases for tax withholdings for net settlement of equity awards. This was offset by $20 million cash provided from a new term loan as part of our Second A&R Credit Agreement in October 2022.
CONTRACTUAL OBLIGATIONS
The following table outlines our contractual payment obligations as of December 31, 2022 (in thousands):
Total | Less than 1 Year | 2 – 5 Years | After 5 Years | |||||||||||||||||||||||
| Term Loan | $ | 184,338 | $ | 9,550 | $ | 174,788 | $ | — | ||||||||||||||||||
| Other long-term debt | 815 | 160 | 655 | — | ||||||||||||||||||||||
| Operating leases | 31,337 | 6,901 | 22,631 | 1,805 | ||||||||||||||||||||||
| Unconditional purchase obligations | 29,123 | 29,123 | — | — | ||||||||||||||||||||||
| $ | 245,613 | $ | 45,734 | $ | 198,074 | $ | 1,805 | |||||||||||||||||||
40
Other contractual arrangements that may result in cash payments consisted of the following at December 31, 2022 (in thousands):
Total | Less than 1 Year | 2 – 5 Years | After 5 Years | ||||||||||||||||||||
| Stand-by letters of credit | 3,143 | 1,382 | 1,062 | 699 | |||||||||||||||||||
| $ | 3,143 | $ | 1,382 | $ | 1,062 | $ | 699 | ||||||||||||||||
We entered into a long-term agreement to purchase a variety of information technology solutions from a third party in the second quarter of 2020, which included an unconditional commitment to purchase a minimum of $32.2 million of products and services over the initial five years of the agreement. We have purchased $19.9 million of products and services pursuant to this agreement as of December 31, 2022.
We have letters of credit that are used as security deposits in connection with our leased Burlington, Massachusetts headquarters office space. In the event of default on the underlying leases, the landlords would, at December 31, 2022, be eligible to draw against the letters of credit to a maximum of $0.7 million in the aggregate.
In addition, we have letters of credit in connection with security deposits for other facility leases totaling $0.5 million in the aggregate, as well as letters of credit totaling $2.0 million that otherwise support our ongoing operations. These letters of credit have various terms and expire during 2023 and beyond, while some of the letters of credit may automatically renew based on the terms of the underlying agreements.
RECENT ACCOUNTING PRONOUNCEMENTS
Recently Adopted Accounting Pronouncement
See Note B, Summary of Significant Accounting Policies, to our Consolidated Financial Statements in Item 8 of the Form 10-K for a description of recently adopted accounting standards.
Recent Accounting Pronouncement to be Adopted
See Note B, Summary of Significant Accounting Policies, to our Consolidated Financial Statements in Item 8 of the Form 10-K for a description of certain issued accounting standards that have not been adopted and may impact our financial statements in future reporting periods.
ITEM 7A.QUANTITATIVE AND QUALITATIVE DISCLOSURE ABOUT MARKET RISK
Foreign Currency Exchange Risk
We have significant international operations and derive more than half of our revenues from customers outside the United States. This business is, for the most part, transacted through international subsidiaries and generally in the currency of the end-user customers. Therefore, we are exposed to the changes in foreign currency exchange rates that could adversely affect our revenues, net income and cash flow.
For the year ended December 31, 2022, 2021, and 2020, we recorded net losses of $1.4 million, $1.3 million, and $0.4 million, respectively, that resulted from foreign currency denominated transactions and the revaluation of foreign currency denominated assets and liabilities.
A hypothetical change of 10% in appreciation or depreciation of foreign currency exchange rates from the quoted foreign currency exchange rates as of December 31, 2022, would not have a significant impact on our results of operations. For this purpose, “significant” means an impact of more than a 20% change.
Interest Rate Risk
41
The Second A&R Credit Agreement had an initial interest rate of SOFR plus a 0.10% credit spread adjustment plus an applicable margin of 2.5%, with a 0% floor. The applicable margin for SOFR loans under the Second A&R Credit Agreement ranges from 1.75% to 3.0%, depending on the Company’s total net leverage ratio. A hypothetical 10% increase or decrease in interest rates paid on outstanding borrowings under the Second A&R Credit Agreement would not have a material impact on our financial position, results of operations, or cash flows.
42
ITEM 8.FINANCIAL STATEMENTS AND SUPPLEMENTARY FINANCIAL INFORMATION
AVID TECHNOLOGY, INC.
INDEX TO CONSOLIDATED FINANCIAL STATEMENTS
AND FINANCIAL STATEMENT SCHEDULE
| Page | |||||
| CONSOLIDATED FINANCIAL STATEMENTS INCLUDED IN ITEM 8: | |||||
Report of Independent Registered Public Accounting Firm ( | |||||
Consolidated Statements of Comprehensive Income for the years ended December 31, 2022, 2021 and 2020 | |||||
Consolidated Balance Sheets as of December 31, 2022 and 2021 | |||||
Consolidated Statements of Stockholders’ Deficit for the years ended December 31, 2022, 2021 and 2020 | |||||
Consolidated Statements of Cash Flows for the years ended December 31, 2022, 2021 and 2020 | |||||
43
REPORT OF INDEPENDENT REGISTERED PUBLIC ACCOUNTING FIRM
Stockholders and Board of Directors
Avid Technology, Inc.
Burlington, Massachusetts
Opinion on the Consolidated Financial Statements
We have audited the accompanying consolidated balance sheets of Avid Technology, Inc. and subsidiaries (the “Company”) as of December 31, 2022 and 2021, the related consolidated statements of operations, comprehensive income, stockholders’ deficit, and cash flows for each of the three years in the period ended December 31, 2022, and the related notes (collectively referred to as the “consolidated financial statements”). In our opinion, the consolidated financial statements present fairly, in all material respects, the financial position of the Company at December 31, 2022 and 2021, and the results of its operations and its cash flows for each of the three years in the period ended December 31, 2022, in conformity with accounting principles generally accepted in the United States of America.
We also have audited, in accordance with the standards of the Public Company Accounting Oversight Board (United States) (“PCAOB”), the Company’s internal control over financial reporting as of December 31, 2022, based on criteria established in Internal Control – Integrated Framework (2013) issued by the Committee of Sponsoring Organizations of the Treadway Commission (“COSO”) and our report dated March 1, 2023 expressed an adverse opinion thereon.
Basis for Opinion
These consolidated financial statements are the responsibility of the Company’s management. Our responsibility is to express an opinion on the Company’s consolidated financial statements based on our audits. We are a public accounting firm registered with the PCAOB and are required to be independent with respect to the Company in accordance with the U.S. federal securities laws and the applicable rules and regulations of the Securities and Exchange Commission and the PCAOB.
We conducted our audits in accordance with the standards of the PCAOB. Those standards require that we plan and perform the audit to obtain reasonable assurance about whether the consolidated financial statements are free of material misstatement, whether due to error or fraud.
Our audits included performing procedures to assess the risks of material misstatement of the consolidated financial statements, whether due to error or fraud, and performing procedures that respond to those risks. Such procedures included examining, on a test basis, evidence regarding the amounts and disclosures in the consolidated financial statements. Our audits also included evaluating the accounting principles used and significant estimates made by management, as well as evaluating the overall presentation of the consolidated financial statements. We believe that our audits provide a reasonable basis for our opinion.
Critical Audit Matters
The critical audit matters communicated below are matters arising from the current period audit of the consolidated financial statements that were communicated or required to be communicated to the audit committee and that: (1) relate to accounts or disclosures that are material to the consolidated financial statements and (2) involved our especially challenging, subjective, or complex judgments. The communication of critical audit matters does not alter in any way our opinion on the consolidated financial statements, taken as a whole, and we are not, by communicating the critical audit matters below, providing a separate opinion on the critical audit matters or on the accounts or disclosures to which they relate.
Revenue Recognition – Identification of performance obligations in certain contracts
As described in Note B, the Company enters into contracts with customers that include various combinations of products and services, which are generally capable of being distinct and if distinct would be accounted for as separate performance obligations. These arrangements may include a combination of products, support, training, and professional services. Additionally, as described in Note P, the Company, from time to time, enters into enterprise agreements whereby the customer agrees to purchase specified products and services over an extended period of time, often for a single fixed contractual price. For such agreements, management identifies each performance obligation in the contract and allocates the total contract price to each performance obligation based on the relative estimated standalone selling price. Once the transaction price is allocated to the individual
44
performance obligations, the components are recognized in the respective categories of revenue consistent with the timing of the recognition of the Company’s identified performance obligations.
We identified the determination of performance obligations in certain agreements as a critical audit matter. Auditing these transactions was especially challenging and complex due to the effort required to identify the substantial number of varying performance obligations present in each agreement.
The primary procedures we performed to address this critical audit matter included:
•Evaluating management’s accounting policies and practices, including the reasonableness of management’s judgments and assumptions related to the identification of each performance obligation and its pattern of delivery.
•Assessing the Company’s agreements based on magnitude and complexity to identify agreements for testing together with their underlying order documents to evaluate management’s identification of each distinct performance obligation and its respective pattern of revenue recognition.
Revenue Recognition - Standalone selling price on term-based subscription contracts
As described in Note P to the consolidated financial statements, the Company sells subscription versions of many of their software products with monthly, annual and multi-year terms. Subscription services have several performance obligations, including a right to use the software and stand-ready performance obligations to (i) provide unspecified bug fixes and software enhancements, or software updates, and (ii) call support when and if needed. The Company allocates the transaction price of the arrangement based on the relative estimated standalone selling price of each distinct performance obligation.
We identified management’s methodology to estimate the standalone selling price of the right to use the software included in term-based subscription agreements as a critical audit matter. The estimation of the standalone selling price of the right to use the software, which the Company does not sell separately, requires significant management judgment due to the limited observable inputs available and impacts the amount and timing of revenue recorded. Auditing these judgments and management’s methodology required increased auditor effort.
The primary procedures we performed to address this critical audit matter included:
•Evaluating management’s estimation of the standalone selling price of stand-ready performance obligations sold in subscription contracts based on historical sales of similar services sold on a renewal basis.
•Evaluating management’s judgments with respect to the relationship between the right to use the software and the other stand ready obligations included in the contract based on the nature of the product and term of the license.
•Assessing the reasonableness of changes made to the Company’s methodology with respect to the estimation of the standalone selling price of performance obligations sold on term-based subscription contracts as well as the allocation of the total transaction price.
Income Taxes Valuation Allowance in the United States
As described in Notes B and N to the consolidated financial statements, the Company reduces its deferred tax assets by a valuation allowance, if based upon the weight of all available evidence, it is more likely than not that some portion, or all, of the deferred tax asset will not be realized. Additionally, as described in Note N to the Company’s consolidated financial statements, the Company has approximately $15.85 million of net deferred income tax assets. Included in this amount is a significant domestic net deferred tax asset, fully offset by a valuation allowance. In general, the ultimate realization of the net deferred tax assets is dependent upon the generation of sufficient future taxable income in the applicable tax jurisdictions. Management believes that as a result of the long history of U.S. book and tax losses and various other economic factors, a valuation allowance is appropriate based on the weight of available negative evidence.
We identified accounting for income taxes, specifically management’s evaluation of whether its domestic deferred tax assets are realizable as a critical audit matter. Significant management judgments are required in evaluating and weighing the collective positive and negative evidence, which is both objectively verifiable and subjective, that are used to assess the realizability of deferred tax assets. Specifically, the upward trend of domestic earnings in recent years further increases the level of judgement required by management in assessing the weight of all available positive and negative evidence. Auditing management’s assessment involved especially complex auditor judgment due to the nature and extent of audit effort required to address this matter, including the need to involve professionals with specialized skill and knowledge.
The primary procedures we performed to address this critical audit matter included:
45
•Evaluating the appropriateness and accuracy of the gross deferred tax assets and deferred tax liabilities by testing amounts for accuracy and assessing significant changes by nature of the tax item.
•Evaluating the reasonableness of management’s weighing of all available positive and negative evidence, both objectively verifiable and subjective, including
i.the Company’s assessment of its ability to carryback losses or credits,
ii.reversals of existing gross deferred tax assets and liabilities,
iii.management’s assessment of available tax-planning strategies, and
iv.management’s assessment and consideration of recent current performance relative to past historical performance of the Company and their conclusion that this outweighs the Company’s ability to rely on forecasted future income, and whether the information was materially consistent with evidence obtained in other areas of the audit.
•Utilizing professionals with specialized knowledge and skills in accounting for income taxes to assist in the evaluation of the positive and negative evidence considered and the analysis of the realizability of deferred tax assets
/s/ BDO USA, LLP
We have served as the Company's auditor since 2016.
Boston, Massachusetts
March 1, 2023
46
AVID TECHNOLOGY, INC.
CONSOLIDATED STATEMENTS OF OPERATIONS
(in thousands, except per share data)
| Year Ended December 31, | |||||||||||||||||
| 2022 | 2021 | 2020 | |||||||||||||||
| Net revenues: | |||||||||||||||||
| Subscription | $ | $ | $ | ||||||||||||||
| Maintenance | |||||||||||||||||
| Integrated solutions & other | |||||||||||||||||
| Total net revenues | |||||||||||||||||
| Cost of revenues: | |||||||||||||||||
| Subscription | |||||||||||||||||
| Maintenance | |||||||||||||||||
| Integrated solutions & other | |||||||||||||||||
| Total cost of revenues | |||||||||||||||||
| Gross profit | |||||||||||||||||
| Operating expenses: | |||||||||||||||||
| Research and development | |||||||||||||||||
| Marketing and selling | |||||||||||||||||
| General and administrative | |||||||||||||||||
| Restructuring costs, net | |||||||||||||||||
| Total operating expenses | |||||||||||||||||
| Operating income | |||||||||||||||||
| Interest income | |||||||||||||||||
| Interest expense | ( | ( | ( | ||||||||||||||
| Other income, net | |||||||||||||||||
| Income before income taxes | |||||||||||||||||
| (Benefit from) Provision for income taxes | ( | ||||||||||||||||
| Net income | $ | $ | $ | ||||||||||||||
| Net income per common share – basic | $ | $ | $ | ||||||||||||||
| Net income per common share – diluted | $ | $ | $ | ||||||||||||||
| Weighted-average common shares outstanding – basic | |||||||||||||||||
| Weighted-average common shares outstanding – diluted | |||||||||||||||||
The accompanying notes are an integral part of the consolidated financial statements.
47
AVID TECHNOLOGY, INC.
CONSOLIDATED STATEMENTS OF COMPREHENSIVE INCOME
(in thousands)
| Year Ended December 31, | |||||||||||||||||
| 2022 | 2021 | 2020 | |||||||||||||||
| Net income | $ | $ | $ | ||||||||||||||
| Other comprehensive (loss) income: | |||||||||||||||||
| Foreign currency translation adjustments | ( | ( | |||||||||||||||
| Comprehensive income | $ | $ | $ | ||||||||||||||
The accompanying notes are an integral part of the consolidated financial statements.
48
AVID TECHNOLOGY, INC.
CONSOLIDATED BALANCE SHEETS
(in thousands, except per share data)
| December 31, | |||||||||||
| 2022 | 2021 | ||||||||||
| ASSETS | |||||||||||
| Current assets: | |||||||||||
| Cash and cash equivalents | $ | $ | |||||||||
| Restricted cash | |||||||||||
Accounts receivable, net of allowances of $ | |||||||||||
| Inventories | |||||||||||
| Prepaid expenses | |||||||||||
| Contract assets | |||||||||||
| Other current assets | |||||||||||
| Total current assets | |||||||||||
| Property and equipment, net | |||||||||||
| Goodwill | |||||||||||
| Right of use assets | |||||||||||
| Deferred tax assets, net | |||||||||||
| Other long-term assets | |||||||||||
| Total assets | $ | $ | |||||||||
| LIABILITIES AND STOCKHOLDERS’ DEFICIT | |||||||||||
| Current liabilities: | |||||||||||
| Accounts payable | $ | $ | |||||||||
| Accrued compensation and benefits | |||||||||||
| Accrued expenses and other current liabilities | |||||||||||
| Income taxes payable | |||||||||||
| Short-term debt | |||||||||||
| Deferred revenues, short term | |||||||||||
| Total current liabilities | |||||||||||
| Long-term debt | |||||||||||
| Long-term deferred revenues | |||||||||||
| Long-term lease liabilities | |||||||||||
| Other long-term liabilities | |||||||||||
| Total liabilities | |||||||||||
| Commitments and contingencies (Note K) | |||||||||||
| Stockholders’ deficit: | |||||||||||
Preferred stock, $ | |||||||||||
Common stock, $ | |||||||||||
Treasury stock at cost, 2,911 and 874 shares at December 31, 2022 and 2021, respectively. | ( | ( | |||||||||
| Additional paid-in capital | |||||||||||
| Accumulated deficit | ( | ( | |||||||||
| Accumulated other comprehensive loss | ( | ( | |||||||||
| Total stockholders’ deficit | ( | ( | |||||||||
| Total liabilities and stockholders’ deficit | $ | $ | |||||||||
The accompanying notes are an integral part of the consolidated financial statements.
49
AVID TECHNOLOGY, INC.
CONSOLIDATED STATEMENTS OF STOCKHOLDERS’ DEFICIT
(in thousands)
| Shares of Common Stock | Additional | Accumulated Other | Total | ||||||||||||||||||||||||||
| Issued | In Treasury | Common Stock | Treasury Stock | Paid-in Capital | Accumulated Deficit | Comprehensive Income (Loss) | Stockholders’ Deficit | ||||||||||||||||||||||
| Balances at December 31, 2019 | $ | $ | $ | $ | ( | $ | ( | $ | ( | ||||||||||||||||||||
| Stock issued pursuant to employee stock plans, net of shares withheld for employee tax obligations | ( | — | — | ( | |||||||||||||||||||||||||
| Stock-based compensation | — | — | — | — | — | — | |||||||||||||||||||||||
| Net income | — | — | — | — | — | — | |||||||||||||||||||||||
| Other comprehensive income | — | — | — | — | — | — | |||||||||||||||||||||||
| Balances at December 31, 2020 | ( | ( | ( | ||||||||||||||||||||||||||
| Stock issued pursuant to employee stock plans, net of shares withheld for employee tax obligations | — | — | ( | — | — | ( | |||||||||||||||||||||||
| Repurchase of common stock | — | ( | — | ( | — | — | — | ( | |||||||||||||||||||||
| Stock-based compensation | — | — | — | — | — | — | |||||||||||||||||||||||
| Net income | — | — | — | — | — | — | |||||||||||||||||||||||
| Other comprehensive loss | — | — | — | — | — | — | ( | ( | |||||||||||||||||||||
| Balances at December 31, 2021 | ( | ( | ( | ( | ( | ||||||||||||||||||||||||
| Stock issued pursuant to employee stock plans, net of shares withheld for employee tax obligations | — | — | ( | — | — | ( | |||||||||||||||||||||||
| Repurchase of common stock | — | ( | — | ( | — | — | — | ( | |||||||||||||||||||||
| Stock-based compensation | — | — | — | — | — | — | |||||||||||||||||||||||
| Net income | — | — | — | — | — | — | |||||||||||||||||||||||
| Other comprehensive loss | — | — | — | — | — | — | ( | ( | |||||||||||||||||||||
| Balances at December 31, 2022 | ( | $ | $ | ( | $ | $ | ( | $ | ( | $ | ( | ||||||||||||||||||
The accompanying notes are an integral part of the consolidated financial statements.
50
AVID TECHNOLOGY, INC.
CONSOLIDATED STATEMENTS OF CASH FLOWS
(in thousands)
| Year Ended December 31, | |||||||||||||||||
| 2022 | 2021 | 2020 | |||||||||||||||
| Cash flows from operating activities: | |||||||||||||||||
| Net income | $ | $ | $ | ||||||||||||||
| Adjustments to reconcile net income to net cash provided by operating activities: | |||||||||||||||||
| Depreciation and amortization | |||||||||||||||||
| Provision for doubtful accounts | |||||||||||||||||
| Loss on extinguishment of debt | |||||||||||||||||
| Stock-based compensation expense | |||||||||||||||||
| Non-cash provision for restructuring | |||||||||||||||||
| Non-cash interest expense | |||||||||||||||||
| Gain on forgiveness of PPP loan | ( | ||||||||||||||||
| Loss on disposal of fixed assets | |||||||||||||||||
| Unrealized foreign currency transaction (gains) losses | ( | ( | |||||||||||||||
| (Benefit from) provision for deferred taxes | ( | ||||||||||||||||
| Changes in operating assets and liabilities: | |||||||||||||||||
| Accounts receivable | ( | ( | |||||||||||||||
| Inventories | ( | ||||||||||||||||
| Prepaid expenses and other assets | ( | ( | |||||||||||||||
| Accounts payable | ( | ||||||||||||||||
| Accrued expenses, compensation and benefits and other liabilities | ( | ||||||||||||||||
| Income taxes payable | ( | ( | ( | ||||||||||||||
| Deferred revenue and contract assets | ( | ( | |||||||||||||||
| Net cash provided by operating activities | |||||||||||||||||
| Cash flows from investing activities: | |||||||||||||||||
| Purchases of property and equipment | ( | ( | ( | ||||||||||||||
| Net cash used in investing activities | ( | ( | ( | ||||||||||||||
| Cash flows from financing activities: | |||||||||||||||||
| Proceeds from revolving line of credit | |||||||||||||||||
| Repayment on revolving line of credit | ( | ( | |||||||||||||||
| Proceeds from long-term debt | |||||||||||||||||
| Repayment of debt | ( | ( | ( | ||||||||||||||
| Payments for repurchase of common stock | ( | ( | |||||||||||||||
| Payments for repurchase of outstanding notes | ( | ||||||||||||||||
| Proceeds from the issuance of common stock under employee stock plans | |||||||||||||||||
| Common stock repurchases for tax withholdings for net settlement of equity awards | ( | ( | ( | ||||||||||||||
| Prepayment penalty on extinguishment of debt | ( | ||||||||||||||||
| Partial retirement of the convertible notes conversion feature and capped call option unwind | |||||||||||||||||
| Payments for credit facility issuance costs | ( | ( | ( | ||||||||||||||
| Net cash used in financing activities | ( | ( | ( | ||||||||||||||
| Effect of exchange rate changes on cash, cash equivalents and restricted cash | ( | ( | |||||||||||||||
| Net (decrease) increase in cash, cash equivalents and restricted cash | ( | ( | |||||||||||||||
| Cash, cash equivalents and restricted cash at beginning of year | |||||||||||||||||
| Cash, cash equivalents and restricted cash at end of year | $ | $ | $ | ||||||||||||||
| Supplemental information: | |||||||||||||||||
| Cash and cash equivalents | $ | $ | $ | ||||||||||||||
| Restricted cash | $ | ||||||||||||||||
| Restricted cash included in other long-term assets | $ | ||||||||||||||||
| Total cash, cash equivalents and restricted cash shown in the statement of cash flows | $ | $ | $ | ||||||||||||||
| Cash paid (refunded) for income taxes, net | $ | $ | $ | ( | |||||||||||||
| Cash paid for interest | $ | $ | $ | ||||||||||||||
| Non-cash transaction – property and equipment included in accounts payable or accruals | $ | $ | $ | ||||||||||||||
The accompanying notes are an integral part of the consolidated financial statements.
51
AVID TECHNOLOGY, INC.
NOTES TO CONSOLIDATED FINANCIAL STATEMENTS
A.BUSINESS
Description of Business
Avid Technology, Inc. (“Avid”, “we” or “us”) develops, markets, sells, and supports software and integrated solutions for video and audio content creation, management, and distribution. We are a leading technology provider that powers the media and entertainment industry. We do this by providing an open and efficient platform for digital media, along with a comprehensive set of tools and workflow solutions. Our solutions are used in production and post-production facilities; film studios; network, affiliate, independent and cable television stations; recording studios; live-sound performance venues; advertising agencies; government and educational institutions; corporate communications departments; and by independent video and audio creative professionals, as well as aspiring professionals. Projects produced using our tools, platform, and ecosystem include feature films, television programming, live events, news broadcasts, sports productions, commercials, music, video, and other digital media content.
Subsequent Event
On January 25, 2023, we announced a voluntary early retirement program, in order to realign the organization and enable further investment in key priority areas and proactively manage transitional planning. The program is currently made available to those employees in the US who were at least 58 years old with 4 or more years of service at Avid. Employees had until February 13, 2023 to opt in to the program. We are still in the process of evaluating the impact for those who opt in to the program.
B.SUMMARY OF SIGNIFICANT ACCOUNTING POLICIES
Principles of Consolidation
The consolidated financial statements include our accounts and our wholly owned subsidiaries. Intercompany balances and transactions have been eliminated.
Basis of Presentation and Use of Estimates
Our preparation of financial statements in conformity with accounting principles generally accepted in the United States of America (“U.S. GAAP”) requires management to make estimates and assumptions that affect the reported amounts of assets and liabilities and disclosures of contingent assets and liabilities at the dates of the financial statements and the reported amounts of revenues and expenses during the reported periods. Actual results could differ from our estimates.
Immaterial corrections from a previous year:
During the fourth quarter of 2022, the Company recorded an adjustment of approximately $2.0 million to subscription revenue related to a correction of an immaterial error in our standalone selling prices related to the prior years. We determined the adjustment was not material to any prior periods presented in the accompanying consolidated financial statements and the notes hereto.
Revenue Recognition
We enter into contracts with customers that include various combinations of products and services, which are typically capable of being distinct and are accounted for as separate performance obligations. We account for a contract when (i) it has approval and commitment from both parties, (ii) the rights of the parties have been identified, (iii) payment terms have been identified, (iv) the contract has commercial substance, and (v) collectability is probable. We recognize revenue upon transfer of control of promised products or services to customers, which typically occurs upon shipment or delivery depending on the terms of the underlying contracts, in an amount that reflects the consideration we expect to receive in exchange for those products or services.
52
See Note P for disaggregated revenue schedules and further discussion on revenue and deferred revenue performance obligations and the timing of revenue recognition.
We often enter into contractual arrangements that have multiple performance obligations, one or more of which may be delivered subsequent to the delivery of other performance obligations. These arrangements may include a combination of products, maintenance, training, and professional services. We allocate the transaction price of the arrangement based on the relative estimated standalone selling price, or SSP, of each distinct performance obligation.
Our process for determining SSP for each performance obligation involves significant management judgment. In determining SSP, we maximize observable inputs and consider a number of data points, including:
•the pricing of standalone sales (in the limited instances where available);
•the pricing established by management when setting prices for deliverables that are intended to be sold on a standalone basis;
•contractually stated prices for deliverables that are intended to be sold on a standalone basis;
•other pricing factors, such as the geographical region in which the products are sold and expected discounts based on the customer size and type.
Determining SSP for performance obligations which we never sell separately also requires significant judgment. In estimating the SSP in these circumstances, we consider the likely price that would have resulted from established pricing practices had the deliverable been offered separately and the prices a customer would likely be willing to pay.
We only include estimated amounts in the transaction price to the extent it is probable that a significant reversal of cumulative revenue recognized will not occur when the uncertainty associated with the variable consideration is resolved. We reduce transaction prices for estimated returns and other allowances that represent variable consideration and record a corresponding refund liability as a component of accrued expenses and other current liabilities. Other forms of contingent revenue or variable consideration are infrequent.
While not a common practice for us, in the event we grant the customer the option to acquire additional products or services in an arrangement, we consider if the option provides a material right to the customer that it would not receive without entering into the contract (e.g., an incremental discount compared to the range of discounts typically given for similar products or services). If a material right is deemed to exist, we account for the option as a distinct performance obligation and recognize revenue when those future products or services are transferred or when the option expires.
We also record as revenue all amounts billed to customers for shipping and handling costs and record the actual shipping costs as a component of cost of revenues. Reimbursements received from customers for out-of-pocket expenses are recorded as revenues, with related costs recorded as cost of revenues. We present revenues net of any taxes collected from customers and remitted to government authorities.
Our contracts rarely contain significant financing components as payments from customers are due within a short period from when our performance obligations are satisfied.
We are applying the practical expedient for the deferral of sales commissions and other contract acquisition costs, which are expensed as incurred, because the amortization period would be one year or less.
Allowance for Sales Returns and Exchanges
We maintain allowances for estimated potential sales returns and exchanges from our customers, which represents variable consideration under ASC 606. We record a provision for estimated returns and other allowances as a reduction of revenues in the same period that related revenues are recorded based on historical experience and specific customer analysis. Use of management estimates is required in connection with establishing and maintaining a sales allowance for expected returns and other credits. The allowance also includes rebates offered through our partner program. If actual returns differ from the estimates, additional allowances could be required.
53
The following table sets forth the activity in the allowance for sales returns and exchanges for the years ended December 31, 2022, 2021, and 2020 (in thousands):
| Year Ended December 31, | |||||||||||||||||
| 2022 | 2021 | 2020 | |||||||||||||||
Allowance for sales returns and exchanges – beginning of year | $ | $ | $ | ||||||||||||||
| Additions and adjustments to the allowance | |||||||||||||||||
| Deductions against the allowance | ( | ( | ( | ||||||||||||||
Allowance for sales returns and exchanges – end of year | $ | $ | $ | ||||||||||||||
The allowance for sales returns and exchanges reflects an estimate of amounts invoiced that will not be collected, as well as other allowances and credits that have been or are expected to offset the trade receivables. The allowance for sales returns and exchanges is recorded as a component of accrued expenses and other current liabilities as of December 31, 2022, December 31, 2021 and December 31, 2020.
Trade Receivables and Allowances for Doubtful Accounts
We classify our right to consideration in exchange for deliverables as either a receivable or a contract asset. A receivable is a right to consideration that is unconditional (i.e. only the passage of time is required before payment is due). We present such receivables in accounts receivable, net of allowance for doubtful accounts, in our consolidated balance sheets. We maintain allowances for estimated losses from bad debt resulting from the inability of our customers to make required payments for products or services. When evaluating the adequacy of the allowances, we analyze accounts receivable balances, historical bad debt experience, customer concentrations, customer credit worthiness, and current economic trends. To date, actual bad debts have not differed materially from management’s estimates.
The following table sets forth the activity in the allowance for doubtful accounts for the years ended December 31, 2022, 2021, and 2020 (in thousands):
| Year Ended December 31, | |||||||||||||||||
| 2022 | 2021 | 2020 | |||||||||||||||
Allowance for doubtful accounts – beginning of year | $ | $ | $ | ||||||||||||||
| Provision for doubtful accounts | |||||||||||||||||
| Reduction in allowance for doubtful accounts | ( | ( | ( | ||||||||||||||
Allowance for doubtful accounts – end of year | $ | $ | $ | ||||||||||||||
Translation of Foreign Currencies
The functional currency of each of our foreign subsidiaries is the local currency, except for the Irish manufacturing branch and Orad Hi-Tech Systems Ltd. (“Orad”) that we acquired in June 2015. The functional currency for both the Irish manufacturing branch and Orad is the U.S. dollar due to the extensive interrelationship of the operations of the Irish branch, Orad, and the U.S. parent, and the high volume of intercompany transactions among the two subsidiaries and the parent. The assets and liabilities of the subsidiaries whose functional currencies are currencies other than the U.S. dollar are translated into U.S. dollars at the current exchange rate in effect at the balance sheet date. Income and expense items for these entities are translated using rates that approximate those in effect during the period. Cumulative translation adjustments are included in accumulated other comprehensive income (loss), which is reflected as a separate component of stockholders’ deficit. We do not record tax provisions or benefits for the net changes in the foreign currency translation adjustment as we intend to permanently reinvest undistributed earnings in our foreign subsidiaries.
The U.S. parent company, Irish manufacturing branch, and Orad, all of whose functional currency is the U.S. dollar, carry certain monetary assets and liabilities denominated in currencies other than the U.S. dollar. These assets and liabilities typically include cash, accounts receivable, and intercompany operating balances denominated in foreign currencies. These assets and liabilities are remeasured into the U.S. dollar at the current exchange rate in effect at the balance sheet date. Foreign currency transaction and remeasurement gains and losses are included within marketing and selling expenses in the results of operations.
54
The U.S. parent company and various other wholly owned subsidiaries have long-term intercompany loan balances denominated in foreign currencies that are remeasured into the U.S. dollar at the current exchange rate in effect at the balance sheet date. Such loan balances are not expected to be settled in the foreseeable future. Any gains and losses relating to these loans are included in the accumulated other comprehensive income (loss), which is reflected as a separate component of stockholders’ deficit.
We have significant international operations and, therefore, our revenues, earnings, cash flows, and financial position are exposed to foreign currency risk from foreign-currency-denominated receivables, payables, sales and expense transactions, and net investments in foreign operations. We derive more than half of our revenues from customers outside the United States. The business is, for the most part, transacted through international subsidiaries and generally in the currency of the end-user customers. Therefore, we are exposed to the risks that changes in foreign currency could adversely affect our revenues, net income, cash flow, and financial position. Foreign currency transaction and remeasurement losses and gains are included within marketing and selling expenses in the results of operations. For the year ended December 31, 2022, 2021, and 2020 we recorded net losses of $1.4 million, $1.3 million, and $0.4 million respectively, that resulted from foreign currency denominated transactions and the revaluation of foreign currency denominated assets and liabilities.
Concentration of Credit Risk
Financial instruments that potentially subject us to concentrations of credit risk consist of cash, cash equivalents, restricted cash, and accounts receivable. We place our cash and cash equivalents with financial institutions that management believes to be of high credit quality. Concentrations of credit risk with respect to trade receivables are limited due to the large number of customers that make up our customer base and their dispersion across different regions. No individual customer accounted for 10 % or more of our total net revenues or net accounts receivable in the periods presented.
Inventories
Inventories are stated at the lower of cost (determined on a first-in, first-out basis) or net realizable value. Management regularly reviews inventory quantities on hand and writes down inventory to our realizable value to reflect estimated obsolescence or lack of marketability based on assumptions about future inventory demand and market conditions. Inventory in the digital-media market, including our inventory, is subject to technological change or obsolescence; therefore, utilization of existing inventory may differ from our estimates.
55
Property and Equipment, Internal Use Software, and Cloud Computing Arrangements
Property and equipment is recorded at cost and depreciated using the straight-line method over the estimated useful life of the asset. We typically depreciate our property and equipment using the following minimum and maximum useful lives:
| Depreciable Life | ||||||||||||||
| Minimum | Maximum | |||||||||||||
| Computer and video equipment and software, including internal use software | ||||||||||||||
| Manufacturing tooling and testbeds | ||||||||||||||
| Office equipment | ||||||||||||||
| Furniture, fixtures, and other | ||||||||||||||
We capitalize certain development costs incurred in connection with our internal use software. Costs incurred in the preliminary stages of development are expensed as incurred. Once an application has reached the development stage, internal and external costs, if direct, are capitalized until the software is substantially complete and ready for its intended use. Capitalized costs are recorded as part of property and equipment. Maintenance and training costs are expensed as incurred. Internal use software is amortized on a straight-line basis over its estimated useful life, generally three years .
We also enter into certain cloud-based software hosting arrangements that are accounted for as service contracts. For internal-use software obtained through a hosting arrangement that is in the nature of a service contract, we incur certain implementation costs such as integrating, configuring, and software customization, which are consistent with costs incurred during the application development stage for on-premise software. We apply the same guidance to determine costs that are eligible for capitalization. For these arrangements, we amortize the capitalized development costs straight-line over the fixed, noncancellable term of the associated hosting arrangement plus any reasonably certain renewal periods. We also apply the same impairment model to both internal-use software and capitalized implementation costs in a software hosting arrangement that is in the nature of a service contract.
Leasehold improvements are amortized over the shorter of the useful life of the improvement or the remaining term of the lease. Expenditures for maintenance and repairs are expensed as incurred. Upon retirement or other disposition of assets, the cost and related accumulated depreciation are eliminated from the accounts and the resulting gain or loss is reflected in “other income, net” in the results of operations.
Long-Lived Assets
We periodically evaluate our long-lived assets for events and circumstances that indicate a potential impairment. If an impairment indicator is present, a long-lived asset is assessed for impairment when the undiscounted expected future cash flows derived from that asset are less than its carrying value. The cash flows used for this analysis take into consideration a number of factors including past operating results, budgets and economic projections, market trends, and product development cycles. The amount of any impairment would be equal to the difference between the estimated fair value of the asset, based on a discounted cash flow analysis, and its carrying value.
Advertising Expenses
All advertising costs are expensed as incurred and are classified as marketing and selling expenses. Advertising expenses for the years ended December 31, 2022, 2021, and 2020 were $2.7 million, $2.9 million, and $0.1 million, respectively.
56
Income Taxes
We account for income taxes using an asset and liability approach that requires the recognition of deferred tax assets and liabilities for the expected future tax consequences of events that have been recognized in our financial statements or tax returns. We record deferred tax assets and liabilities based on the net tax effects of tax credits, operating loss carryforwards, and temporary differences between the carrying amounts of assets and liabilities for financial reporting purposes compared to the amounts used for income tax purposes. Deferred tax assets are regularly reviewed for recoverability with consideration for such factors as historical losses, projected future taxable income, and the expected timing of the reversals of existing temporary differences. We are required to record a valuation allowance when it is more likely than not that some portion or all of the deferred tax assets will not be realized.
The Inflation Reduction Act (IRA) was signed into law on August 16, 2022. The IRA includes, among other things, a corporate alternative minimum tax (CAMT) that applies to certain applicable corporations with average financial statement income in excess of $1 billion. CAMT applies to years beginning in 2023. We do not currently expect a material impact (if any) of the CAMT. The IRA also includes a new U.S. federal 1% excise tax on publicly traded corporations that repurchase their stock, applicable to buybacks occurring on or after January 1, 2023. The amount of the excise tax is generally 1% of the fair market value of the shares repurchased at the time of the repurchase. However, for purposes of calculating the excise tax, repurchasing corporations are permitted to net the fair market value of certain new stock issuances against the fair market value of stock repurchases during the same taxable year.
We account for uncertainty in income taxes recognized in our financial statements by applying a two-step process to determine the amount of tax benefit to be recognized. First, the tax position must be evaluated to determine the likelihood that it will be sustained upon examination by the taxing authorities, based on the technical merits of the position. If the tax position is deemed more-likely-than-not to be sustained, the tax position is then assessed to determine the amount of benefit to recognize in the financial statements. The amount of the benefit that may be recognized is the largest amount that has a greater than 50% likelihood of being realized upon ultimate settlement. The provision for income taxes includes the effects of any resulting tax reserves (“unrecognized tax benefits”) that are considered appropriate, as well as the related net interest and penalties.
Accounting for Stock-Based Compensation
Our stock-based employee compensation plans allow us to grant stock awards, options, or other equity-based instruments, or a combination thereof, as part of our overall compensation strategy. For stock-based awards granted, we record stock-based compensation expense based on the grant date fair value over the requisite service periods for the individual awards, which generally equal the vesting periods. The vesting of stock-based award grants may be based on time, performance conditions, market conditions, or a combination of time, performance and market conditions. We account for forfeitures when they occur.
Certain Company stock-based compensation awards contain provisions that allow for continued vesting into retirement. Stock-based awards are considered fully vested for expense attribution purposes when the employee's retention of the award is no longer contingent on providing subsequent service.
Product Warranties
We provide warranties on externally sourced and internally developed hardware. The warranty period for all of our products is generally 90 days to one year, but can extend up to five years depending on the manufacturer’s warranty or local law. For internally developed hardware and in cases where the warranty granted to customers for externally sourced hardware is greater than that provided by the manufacturer, we record an accrual for the related liability based on historical trends and actual material and labor costs. At the end of each quarter, we reevaluate our estimates to assess the adequacy of the recorded warranty liabilities and adjusts the accrued amounts accordingly.
57
Accounting for Restructuring Plans
Based on our policies for the calculation and payment of severance benefits, we account for employee-related restructuring charges as an ongoing benefit arrangement in accordance with ASC Topic 712, Compensation - Nonretirement Postemployment Benefits.
Related Party Transactions
From time to time we enter into arrangements with parties which may be affiliated with us, executive officers, and members of our board of directors. These transactions are primarily comprised of sales transactions in the normal course of business and are immaterial to the financial statements for all periods presented.
Leases
We have entered into a number of facility leases to support our research and development activities, sales operations, and other corporate and administrative functions in North America, Europe, the Middle East, and Asia, which qualify as operating leases under U.S. GAAP. We also have a limited number of equipment leases that also qualify as operating leases. We determine if contracts with vendors represent a lease or have a lease component under U.S. GAAP at contract inception. During 2020, we also entered into a limited number of equipment leases that qualify as finance leases. Our leases have remaining terms ranging from less than one year to six years . We lease corporate office space in Burlington, Massachusetts, which expires in May 2028. Some of our leases include options to extend or terminate the lease prior to the end of the agreed upon lease term. For purposes of calculating lease liabilities, lease terms include options to extend or terminate the lease when it is reasonably certain that we will exercise such options.
Operating lease right of use assets and liabilities are recognized based on the present value of the future minimum lease payments over the lease term at the lease commencement date. As our leases generally do not provide an implicit rate, we use an estimated incremental borrowing rate in determining the present value of future payments. The incremental borrowing rate represents an estimate of the interest rate we would incur at lease commencement to borrow an amount equal to the lease payments on a collateralized basis over the term of a lease within a particular location and currency environment. The operating leases are included in “Right of use assets,” “Accrued expenses and other current liabilities,” and “Long-term lease liabilities” on our consolidated balance sheets.
Finance lease right of use assets and liabilities are recognized based on the present value of the future minimum lease payments over the lease term at the lease commencement date. Each lease agreement provides an implicit discount rate used to determine the present value of future payments.
Lease costs are included within cost of revenues and operating expenses on the consolidated statements of operations, and the related cash payments are included in the operating cash flows on the consolidated statements of cash flows. Variable lease costs, finance lease costs, and sublease income are not material.
Our lease agreements do not contain any material residual value guarantees or material restrictive covenants.
We have elected the following lease exceptions and practical expedients:
58
| Separation of lease and non-lease components | Non-lease components are excluded from our right of use (“ROU”) assets and lease liabilities and expensed as incurred. | ||||
| Short-term policy | We have elected the short-term lease recognition exemption for all applicable classes of underlying assets. Short-term disclosures include only those leases with a term greater than one month and 12 months or less, and expense is recognized on a straight-line basis over the lease term. Leases with an initial term of 12 months or less, that do not include an option to purchase the underlying asset that we are reasonably certain to exercise, are not recorded on the consolidated balance sheets. | ||||
Treasury Stock
The Company records the aggregate purchase price of treasury stock at cost and includes treasury stock as a reduction to stockholders' equity.
Recently Adopted Accounting Pronouncement
In March 2020, the Financial Accounting Standards Board (“FASB”) issued ASU 2020-04, Facilitation of the Effects of Reference Rate Reform on Financial Reporting (“ASU 2020-04”). ASU 2020-04 is intended to provide temporary optional expedients and exceptions to the U.S. GAAP guidance on contract modifications and hedge accounting to ease the financial reporting burdens related to the expected market transition from the London Interbank Offered Rate (LIBOR) and other interbank offered rates to alternative reference rates. This guidance is effective beginning on March 12, 2020, and the Company adopted ASU 2020-04 as of January 1, 2022. The Company has determined the impact of this adoption was not material to our consolidated financial statements and related disclosures.
C. NET INCOME PER SHARE
Net income per common share is presented for both Basic EPS and Diluted EPS. Basic EPS is based on the weighted-average number of common shares outstanding during the period. Diluted EPS is based on the weighted-average number of common shares and common shares equivalents outstanding during the period.
The potential common shares that were considered anti-dilutive securities were excluded from the diluted earnings per share calculations for the relevant periods either because the sum of the exercise price per share and the unrecognized compensation cost per share was greater than the average market price of our common stock for the relevant periods, or because they were considered contingently issuable. The contingently issuable potential common shares result from certain stock options and restricted stock units granted to our employees that vest based on performance conditions, market conditions, or a combination of performance and market conditions.
The following table sets forth (in thousands) common shares considered anti-dilutive securities at December 31, 2022, 2021, and 2020:
| December 31, 2022 | December 31, 2021 | December 31, 2020 | |||||||||||||||
| Options | |||||||||||||||||
| Non-vested restricted stock units | |||||||||||||||||
| Anti-dilutive potential common shares | |||||||||||||||||
The following table sets forth (in thousands) the basic and diluted weighted common shares outstanding at December 31, 2022, 2021, and 2020:
59
| 2022 | 2021 | 2020 | |||||||||||||||
| Weighted common shares outstanding - basic | |||||||||||||||||
| Net effect of common stock equivalents | |||||||||||||||||
| Weighted common shares outstanding - diluted | |||||||||||||||||
D. FAIR VALUE MEASUREMENTS
Assets and Liabilities Measured at Fair Value on a Recurring Basis
We measure deferred compensation investments on a recurring basis. At December 31, 2022 and 2021, our deferred compensation investments were classified as either Level 1 or Level 2 in the fair value hierarchy. Assets valued using quoted market prices in active markets and classified as Level 1 are money market and mutual funds. Assets valued based on other observable inputs and classified as Level 2 are insurance contracts. The assets held at fair value are included in “Other current assets” and “Other long-term assets” on our consolidated balance sheet as of December 31, 2022 and 2021 .
The following tables summarize our deferred compensation investments measured at fair value on a recurring basis (in thousands):
| Fair Value Measurements at Reporting Date Using | |||||||||||||||||||||||
| December 31, 2022 | Quoted Prices in Active Markets for Identical Assets (Level 1) | Significant Other Observable Inputs (Level 2) | Significant Unobservable Inputs (Level 3) | ||||||||||||||||||||
| Financial Assets: | |||||||||||||||||||||||
| Deferred compensation investments | $ | $ | $ | $ | |||||||||||||||||||
| Fair Value Measurements at Reporting Date Using | |||||||||||||||||||||||
| December 31, 2021 | Quoted Prices in Active Markets for Identical Assets (Level 1) | Significant Other Observable Inputs (Level 2) | Significant Unobservable Inputs (Level 3) | ||||||||||||||||||||
| Financial Assets: | |||||||||||||||||||||||
| Deferred compensation investments | $ | $ | $ | $ | |||||||||||||||||||
Financial Instruments Not Recorded at Fair Value
The carrying amounts of our other financial assets and liabilities including cash, accounts receivable, accounts payable, and accrued liabilities approximate their respective fair values because of the relatively short period of time between their origination and their expected realization or settlement. The carrying value of the term loan is net of debt issuance costs and approximates its fair value.
E INVENTORIES
Inventories consisted of the following at December 31, 2022 and 2021 (in thousands):
| December 31, | |||||||||||
| 2022 | 2021 | ||||||||||
| Raw materials | $ | $ | |||||||||
| Work in process | |||||||||||
| Finished goods | |||||||||||
| Total | $ | $ | |||||||||
60
F. PROPERTY, PLANT AND EQUIPMENT
Property and equipment consisted of the following at December 31, 2022 and 2021 (in thousands):
| December 31, | ||||||||||||||
| 2022 | 2021 | |||||||||||||
| Computer and video equipment and software | $ | $ | ||||||||||||
| Manufacturing tooling and testbeds | ||||||||||||||
| Office equipment | ||||||||||||||
| Furniture, fixtures and other | ||||||||||||||
| Leasehold improvements | ||||||||||||||
| Less: accumulated depreciation and amortization | ||||||||||||||
| Total | $ | $ | ||||||||||||
We capitalize certain development costs incurred in connection with our internal use software. For the year ended December 31, 2022, we capitalized $8.8 million of contract labor and internal labor costs related to internal use software, and recorded the capitalized costs in computer and video equipment and software. There were $2.6 million of contract labor and internal labor costs capitalized for the year ended December 31, 2021. Internal use software is amortized on a straight line basis over its estimated useful life of three years , and we recorded amortization expense of $3.8 3.1 million for the years ended December 31, 2022, 2021, and 2020 respectively.
Depreciation and amortization expense related to property and equipment was $8.3 million, $8.3 million, and $8.5 million for the years ended December 31, 2022, 2021, and 2020 respectively.
The following table presents our long-lived assets by geography at December 31, 2022 and 2021 (in thousands):
| December 31, | |||||||||||
| 2022 | 2021 | ||||||||||
| United States | $ | 46,338 | $ | 38,408 | |||||||
| Other countries | 7,917 | 8,223 | |||||||||
| Total | $ | 54,255 | $ | 46,631 | |||||||
G. GOODWILL
H. LEASES
As of December 31, 2022, the weighted average incremental borrowing rate on our operating leases was 5.9 % and the weighted average remaining lease term was 5.1 years. Lease costs for minimum lease payments is recognized on a straight-line basis over the lease term. Our total lease costs were $5.8 million, $7.1 million, and $9.1 million, and total related cash payments were $6.2 million, $7.6 million, and $9.0 million for the years ended December 31, 2022, 2021, and 2020, respectively. Short term lease costs were $2.4 million and $1.8 million for the years ended December 31, 2022 and 2021, respectively, and were immaterial for the year ended December 31, 2020. Right of use assets obtained in exchange for new operating lease liabilities were $1.9 million and $0.5 million for the years ended December 31, 2022 and 2021, respectively.
61
The accompanying consolidated results of operations reflect rent expense on a straight-line basis over the term of the leases. Total expense under operating leases was $8.1 million, $9.0 million, and $10.2 million for the years ended December 31, 2022, 2021, and 2020, respectively.
The table below reconciles the undiscounted future minimum lease payments under non-cancelable leases with terms of more than one year to the total lease liabilities recognized on the consolidated balance sheets as of December 31, 2022 (in thousands):
| Year Ending December 31, | Operating Leases | Finance Leases | ||||||
| 2023 | ||||||||
| 2024 | ||||||||
| 2025 | ||||||||
| 2026 | — | |||||||
| 2027 | — | |||||||
| Thereafter | — | |||||||
| Total future minimum lease payments | ||||||||
| Less effects of discounting | ( | ( | ||||||
| Total lease liabilities | $ | $ | ||||||
Operating Leases | December 31, 2022 | ||||
| Right of use assets | $ | ||||
| Long-term lease liabilities | |||||
| Total lease liabilities | $ | ||||
Finance Leases | December 31, 2022 | ||||
| $ | |||||
| Total lease liabilities | $ | ||||
Included in the operating lease commitments below are obligations under leases for which we have vacated the underlying facilities as part of various restructuring plans. These leases expire at various dates through 2026 and represent an aggregate obligation of $1.3 million. We received $0.5 million, $0.6 million, and $0.8 million of sublease income during the years ended December 31, 2022, 2021, and 2020, respectively. The future minimum lease commitments under non-cancelable leases at December 31, 2022 were as follows (in thousands):
| Year Ending December 31, | Operating Leases | ||||
| 2023 | $ | ||||
| 2024 | $ | ||||
| 2025 | $ | ||||
| 2026 | $ | ||||
| 2027 | $ | ||||
| Thereafter | $ | ||||
| Total | $ | ||||
62
Finance lease right of use assets and liabilities are recognized based on the present value of the future minimum lease payments over the lease term at the lease commencement date. Each lease agreement provides an implicit discount rate used to determine the present value of future payments. The weighted-average discount rate is 2.3 % as of September 30, 2020, the commencement date for our leases.
I. ACCRUED EXPENSES AND OTHER CURRENT LIABILITIES
Accrued expenses and other current liabilities consisted of the following at December 31, 2022 and 2021 (in thousands):
| December 31, | |||||||||||
| 2022 | 2021 | ||||||||||
| Consulting and professional fees | $ | $ | |||||||||
| Operating lease liabilities - short term | |||||||||||
| Accrued royalties | |||||||||||
| Accrued warranty | |||||||||||
| Employee restructuring | |||||||||||
| Sales return & allowance | |||||||||||
| Other (individual items less than 5% of total current liabilities) | |||||||||||
| Total | $ | $ | |||||||||
J. OTHER LONG-TERM LIABILITIES
Other long-term liabilities consisted of the following at December 31, 2022 and 2021 (in thousands):
| December 31, | |||||||||||
| 2022 | 2021 | ||||||||||
| Finance lease liabilities | |||||||||||
| Deferred compensation | |||||||||||
| Other long-term liabilities | |||||||||||
| Total | $ | $ | |||||||||
K. COMMITMENTS AND CONTINGENCIES
Commitments
We entered into a long-term agreement to purchase a variety of information technology solutions from a third party in the second quarter of 2020, which included an unconditional commitment to purchase a minimum of $32.2 million of products and services over the initial five-year term of the agreement. We have purchased $19.9 million pursuant to this agreement as of December 31, 2022 to develop Azure-certified solutions which includes developing virtualized versions of many of our product offerings, allowing them to run in a private cloud, public cloud, or in hybrid deployments.
We have letters of credit that are used as security deposits in connection with our leased Burlington, Massachusetts office space. In the event of default on the underlying leases, the landlords would, at December 31, 2022, be eligible to draw against the letters of credit to a maximum of $0.7 million in the aggregate.
We also have letters of credit in connection with security deposits for other facility leases totaling $0.5 million in the aggregate, as well as letters of credit totaling $2.0 million that otherwise support our ongoing operations. These letters of credit have various terms and expire during 2023 and beyond, while some of the letters of credit may automatically renew based on the terms of the underlying agreements.
63
We have future minimum lease commitments under non-cancelable leases totaling $31.3 million which are described in detail in Note H, Leases.
Purchase Commitments and Sole-Source Suppliers
As of December 31, 2022, we have entered into purchase commitments for certain inventory and other goods used in our normal operations. The purchase commitments covered by these agreements are for a period of less than 1 year and in the aggregate total $29.1 million as of December 31, 2022.
We depend on sole-source suppliers for certain key hardware components of our products. Although we have procedures in place to mitigate the risks associated with our sole-sourced suppliers, we cannot be certain that we will be able to obtain sole-sourced components or finished goods from alternative suppliers or that we will be able to do so on commercially reasonable terms without a material impact on our results of operations or financial position. We procure product components and build inventory based on forecasts of product life cycle and customer demand. If we are unable to provide accurate forecasts or manage inventory levels in response to shifts in customer demand, we may have insufficient, excess, or obsolete product inventory.
Contingencies
Our industry is characterized by the existence of a large number of patents and frequent claims and litigation regarding patent and other intellectual property rights. In addition to the legal proceedings described above, we are involved in legal proceedings from time to time arising from the normal course of business activities, including claims of alleged infringement of intellectual property rights and contractual, commercial, employee relations, product or service performance, or other matters. We do not believe these matters will have a material adverse effect on our financial position or results of operations. However, the outcome of legal proceedings and claims brought against us is subject to significant uncertainty. Therefore, our financial position or results of operations may be negatively affected by the unfavorable resolution of one or more of these proceedings for the period in which a matter is resolved. Our results could be materially adversely affected if we are accused of, or found to be, infringing third parties’ intellectual property rights.
Following the termination of our former Chairman and Chief Executive Officer on February 25, 2018, we received a notice alleging that we breached the former employee’s employment agreement. On April 16, 2019 we received an additional notice again alleging we breached the former employee’s employment agreement. We have since been in communications with our former Chairman and Chief Executive Officer’s counsel. While we intend to defend any claim vigorously, when and if a claim is actually filed, we are currently unable to estimate an amount or range of any reasonably possible losses that could occur as a result of this matter.
On July 14, 2020, we sent a notice to a customer demanding sums that we believe are due to Avid pursuant to a contract. On October 7, 2020, the customer sent a notice to us denying any legal liability and demanding payment for breach of contract resulting from various alleged delays by us. While we intend to defend any claim vigorously when and if a claim is actually filed, we are currently unable to estimate an amount or range of any reasonably possible losses that could occur related to this matter.
We consider all claims on a quarterly basis and based on known facts assesses whether potential losses are considered reasonably possible, probable, and estimable. Based upon this assessment, we then evaluate disclosure requirements and whether to accrue for such claims in our consolidated financial statements.
We record a provision for a liability when it is both probable that a liability has been incurred and the amount of the loss can be reasonably estimated and such amount is material. These provisions are reviewed at least quarterly and adjusted to reflect the impacts of negotiations, settlements, rulings, advice of legal counsel, and other information and events pertaining to a particular case. Legal fees are recognized as incurred when the legal services are provided, and therefore are not recognized as part of a loss contingency accrual.
At December 31, 2022 and as of the date of filing of these consolidated financial statements, we believe that, other than as set forth in this note, no provision for liability nor disclosure is required related to any claims because: (a) there is no reasonable possibility that a loss exceeding amounts already recognized (if any) may be incurred with respect to such claim; (b) a reasonably possible loss or range of loss cannot be estimated; or (c) such estimate is immaterial.
64
Additionally, we provide indemnification to certain customers for losses incurred in connection with intellectual property infringement claims brought by third parties with respect to our products. These indemnification provisions generally offer perpetual coverage for infringement claims based upon the products covered by the agreement and the maximum potential amount of future payments we could be required to make under these indemnification provisions is theoretically unlimited. To date, we have not incurred material costs related to these indemnification provisions; accordingly, we believe the estimated fair value of these indemnification provisions is immaterial. Further, certain arrangements with customers include clauses whereby we may be subject to penalties for failure to meet certain performance obligations; however, we have not recorded any related material penalties to date.
We provide warranties on externally sourced and internally developed hardware. For internally developed hardware and in cases where the warranty granted to customers for externally sourced hardware is greater than that provided by the manufacturer, we record an accrual for the related liability based on historical trends and actual material and labor costs. The following table sets forth the activity in the product warranty accrual account for the years ended December 31, 2022, 2021, and 2020 (in thousands):
Accrual balance at January 1, 2020 | $ | ||||
| Accruals for product warranties | |||||
| Cost of warranty claims | ( | ||||
Accrual balance at December 31, 2020 | |||||
| Accruals for product warranties | |||||
| Cost of warranty claims | ( | ||||
Accrual balance at December 31, 2021 | |||||
| Accruals for product warranties | |||||
| Cost of warranty claims | ( | ||||
Accrual balance at December 31, 2022 | $ | ||||
L. CAPITAL STOCK
Preferred Stock
We have authorized up to one million shares of preferred stock, $0.01 par value per share, for issuance. Each series of preferred stock shall have such rights, preferences, privileges, and restrictions, including voting rights, dividend rights, conversion rights, redemption privileges, and liquidation preferences, as may be determined by our board of directors.
Common Stock Repurchases
On September 9, 2021, our board of directors approved the repurchase of up to $115.0 million of our outstanding shares. This authorization does not have a prescribed expiration date. As of December 31, 2022, approximately $37.1 million of the $115.0 million share repurchase authorization remained available. The Company has no obligation to repurchase any amount of its common stock, and the program may be suspended or discontinued at any time. For the year ended December 31, 2022, the Company repurchased 2,036,524 shares of its common stock for $52.8 million. These amounts may differ from the repurchases of common stock amounts in the consolidated statements of cash flows due to unsettled share repurchases at the end of a period.
Stock Incentive Plans
There is an aggregate of 10,540,000 of our shares of $0.01 par value per share common stock authorized and reserved for issuance under the Avid Technology, Inc. Amended and Restated 2014 Stock Incentive Plan (the “Plan”). The Plan was originally adopted by our board of directors on September 14, 2014 and approved by our stockholders on October 29, 2014. In connection with the approval of the Plan, our Amended and Restated 2005 Stock Incentive Plan has been closed; no additional awards may be granted under that 2005 plan. As of December 31, 2022, there were no remaining shares available for issuance under the 2005 plan.
Under the Plan, we may grant stock awards or options to purchase our common stock to employees, officers, directors, and consultants. The exercise price for options generally must be no less than market price on the date of grant. Awards may be
65
performance-based where vesting or exercisability is conditioned on achieving performance objectives, time-based, or a combination of both. Option grants become exercisable over various periods, typically three years to four years for employees and one year for non-employee directors, and have a maximum term of seven years to ten years . Restricted stock unit awards with time-based vesting typically vest over three years to four years for employees and one year for non-employee directors. Certain Company stock-based compensation awards contain provisions that allow for continued vesting into retirement. Stock-based awards are considered fully vested for expense attribution purposes when the employee's retention of the award is no longer contingent on providing subsequent service.
We use the Black-Scholes option pricing model to estimate the fair value of stock option grants with time-based vesting. The Black-Scholes model relies on a number of key assumptions to calculate estimated fair value. The assumed dividend yield of zero is based on the fact that we have never paid cash dividends and has no present expectation to pay cash dividends. The expected volatility is based on actual historic stock volatility for periods equivalent to the expected term of the award. The assumed risk-free interest rate is the U.S. Treasury security rate with a term equal to the expected life of the option. The assumed expected life is based on company-specific historical experience considering the exercise behavior of past grants and models the pattern of aggregate exercises.
The fair value of restricted stock unit awards with time-based vesting is based on the intrinsic value of the awards at the date of grant, as the awards have a purchase price of $0.01 per share.
We also issue option grants or restricted stock unit awards with vesting based on market conditions. Performance-based restricted stock units will vest based on achievement of our relative total shareholder return against the Russell 2000 Index over a three-year period. The fair values and derived service periods for all grants that include vesting based on market conditions are estimated using the Monte Carlo valuation method. For stock option grants that include vesting based on performance conditions, the fair values are estimated using the Black-Scholes option pricing model. For restricted stock unit awards that include vesting based on performance conditions, the fair values are estimated based on the intrinsic values of the awards at the date of grant, as the awards have a purchase price of $0.01 per share.
Information with respect to options granted under all stock option plans for the year ended December 31, 2022 was as follows:
| Total Number of Options | Weighted- Average Exercise Price | Weighted- Average Remaining Contractual Life (years) | Aggregate Intrinsic Value (in thousands) | |||||||||||||||||||||||||||||
Options Outstanding at December 31, 2019 | $ | |||||||||||||||||||||||||||||||
| Granted | ||||||||||||||||||||||||||||||||
| Exercised | ( | |||||||||||||||||||||||||||||||
| Forfeited or Expired | ||||||||||||||||||||||||||||||||
Options Outstanding at December 31, 2020 | $ | $ | ||||||||||||||||||||||||||||||
| Granted | ||||||||||||||||||||||||||||||||
| Exercised | ( | |||||||||||||||||||||||||||||||
| Forfeited or Expired | ||||||||||||||||||||||||||||||||
Options outstanding at December 31, 2021 | $ | $ | ||||||||||||||||||||||||||||||
| Granted | ||||||||||||||||||||||||||||||||
| Exercised | ||||||||||||||||||||||||||||||||
| Forfeited or Expired | ||||||||||||||||||||||||||||||||
Options outstanding at December 31, 2022 | $ | $ | ||||||||||||||||||||||||||||||
| Exercisable at: | ||||||||||||||||||||||||||||||||
| December 31, 2020 | $ | $ | ||||||||||||||||||||||||||||||
December 31, 2021 | $ | $ | ||||||||||||||||||||||||||||||
December 31, 2022 | $ | $ | ||||||||||||||||||||||||||||||
66
The cash received from stock options exercised during the year ended December 31, 2020 was $1.6 million. There was no cash received from stock options exercised during the years ended December 31, 2022 and 2021.
Information with respect to non-vested time-based restricted stock units for the year ended December 31, 2022 was as follows:
| Number of Restricted Stock Units | Weighted- Average Grant-Date Fair Value | Shares Retained to Cover Statutory Minimum Withholding Taxes | |||||||||
Outstanding at December 31, 2019 | $ | ||||||||||
| Granted | |||||||||||
| Vested | ( | ||||||||||
| Forfeited | ( | ||||||||||
Outstanding at December 31, 2020 | $ | ||||||||||
| Granted | |||||||||||
| Vested | ( | ||||||||||
| Forfeited | ( | ||||||||||
Outstanding at December 31, 2021 | $ | ||||||||||
| Granted | |||||||||||
| Vested | ( | ||||||||||
| Forfeited | ( | ||||||||||
Outstanding at December 31, 2022 | $ | ||||||||||
Information with respect to non-vested performance-based restricted stock units for the year ended December 31, 2022 was as follows:
| Number of Performance-based Restricted Stock Units | Weighted- Average Grant-Date Fair Value | Shares Retained to Cover Statutory Minimum Withholding Taxes | |||||||||
Outstanding at December 31, 2019 | $ | ||||||||||
| Granted | |||||||||||
| Vested | ( | ||||||||||
| Forfeited | ( | ||||||||||
Outstanding at December 31, 2020 | $ | ||||||||||
| Granted | |||||||||||
| Vested | ( | ||||||||||
| Forfeited | |||||||||||
Outstanding at December 31, 2021 | $ | ||||||||||
| Granted | |||||||||||
| Vested | ( | ||||||||||
| Forfeited | ( | ||||||||||
Outstanding at December 31, 2022 | $ | ||||||||||
67
The weighted-average grant date fair value of time and performance-based restricted stock units granted during the years ended December 31, 2022, 2021, and 2020 was $28.84 , $22.54 , and $7.05 , respectively. The total weighted-average fair value of time and performance-based restricted stock units vested during the years ended December 31, 2022, 2021, and 2020 was $14.8 million, $12.8 million, and $9.5 million, respectively.
Employee Stock Purchase Plan
On February 27, 2008, the board of directors approved our Second Amended and Restated 1996 Employee Stock Purchase Plan (the “ESPP”). On May 27, 2008 our stockholders approved an increase of the number of shares of our common stock authorized for issuance under the Second Amended and Restated ESPP from 1,700,000 to 2,500,000 shares. In May 2018, we registered an aggregate of 650,000 of our shares of $0.01 par value per share common stock, which have been authorized and reserved for issuance under the Avid Technology, Inc. Second Amended and Restated ESPP.
Our Second Amended and Restated ESPP offers our shares for purchase at a price equal to 85 % of the closing price on the applicable offering period termination date. Shares issued under the ESPP are considered compensatory. Accordingly, we are required to measure fair value and record compensation expense for share purchase rights granted under the ESPP. In July 2015, the board of directors approved an amendment to the ESPP to change the subscription period from to six months and accordingly to adjust the payroll cap to $5,000 per plan period. A total of 451,000 shares remained available for issuance under the ESPP at December 31, 2022.
We use the Black-Scholes option pricing model to calculate the fair value of shares issued under the ESPP. The Black-Scholes model relies on a number of key assumptions to calculate estimated fair values. The following table sets forth the weighted-average key assumptions and fair value results for shares issued under the ESPP during the years ended December 31, 2022, 2021, and 2020:
| Year Ended December 31, | |||||||||||||||||
| 2022 | 2021 | 2020 | |||||||||||||||
| Expected dividend yield | |||||||||||||||||
| Risk-free interest rate | |||||||||||||||||
| Expected volatility | |||||||||||||||||
| Expected life (in years) | |||||||||||||||||
| Weighted-average fair value of shares issued (per share) | $ | $ | $ | ||||||||||||||
The following table sets forth the quantities and average prices of shares issued under the ESPP for the years ended December 31, 2022, 2021, and 2020:
| Year Ended December 31, | |||||||||||||||||
| 2022 | 2021 | 2020 | |||||||||||||||
| Shares issued under the ESPP | |||||||||||||||||
| Average price of shares issued | $ | $ | $ | ||||||||||||||
We did not realize a material tax benefit from the tax deductions for stock option exercises, vested restricted stock units and shares issued under the ESPP during the years ended December 31, 2022, 2021, or 2020.
Stock-Based Compensation Expense
The following table sets forth Stock-based compensation expense by award type for the years ended December 31, 2022, 2021, and 2020, respectively (in thousands):
68
| Year Ended December 31, | |||||||||||||||||
| 2022 | 2021 | 2020 | |||||||||||||||
| Share-based compensation expense by type: | |||||||||||||||||
| Time-based Restricted Stock Units | $ | $ | $ | ||||||||||||||
| Performance-based Restricted Stock Units | |||||||||||||||||
| ESPP | |||||||||||||||||
| Total Share-based compensation expense | $ | $ | $ | ||||||||||||||
Stock-based compensation was included in the following captions in our consolidated statements of operations for the years ended December 31, 2022, 2021, and 2020, respectively (in thousands):
| Year Ended December 31, | |||||||||||||||||
| 2022 | 2021 | 2020 | |||||||||||||||
| Cost of revenues | $ | $ | $ | ||||||||||||||
| Research and development expenses | |||||||||||||||||
| Marketing and selling expenses | |||||||||||||||||
| General and administrative expenses | |||||||||||||||||
| Total | $ | $ | $ | ||||||||||||||
At December 31, 2022, there was $17.9 million of total unrecognized compensation cost related to non-vested stock-based compensation awards granted under our stock-based compensation plans. We expect this amount to be amortized approximately as follows: $10.2 million in 2023, $6.1 million in 2024, and $1.5 million in 2025. At December 31, 2022, the weighted-average recognition period of the unrecognized compensation cost was approximately 1.1 years.
M. EMPLOYEE BENEFIT PLANS
Employee Benefit Plans
We have a Section 401(k) plan, which we refer to as the 401(k) plan, that covers substantially all U.S. employees. The 401(k) plan allows employees to make contributions up to a specified percentage of their compensation. We may, upon resolution by our board of directors, make discretionary contributions to the plan. Our contributions to the 401(k) plan totaled $1.9 million in 2022, $0.7 million in 2021, and $0.5 million in 2020.
In addition, we have various retirement and post-employment plans covering certain international employees. Certain plans allow us to match employee contributions up to a specified percentage as defined by the plans. Our contributions to these plans totaled $1.4 million, $1.4 million, and $1.4 million in 2022, 2021, and 2020 respectively.
Deferred Compensation Plans
We maintain a nonqualified deferred compensation plan (the “Deferred Plan”). The Deferred Plan covers senior management and members of the board of directors. In November 2013, the board of directors determined to indefinitely suspend the Deferred Plan and not offer participants the opportunity to participate in the Deferred Plan as of 2014. The benefits payable under the Deferred Plan represent an unfunded and unsecured contractual obligation to pay the value of the deferred compensation in the future, adjusted to reflect deemed investment performance. Payouts are generally made upon termination of employment with us. The assets of the Deferred Plan, as well as the corresponding obligations, were approximately $0.1 million and $0.1 million at December 31, 2022 and 2021, respectively, and were recorded in “other current assets” and “accrued compensation and benefits” at those dates.
In connection with the acquisition of a business in 2010, we assumed the assets and liabilities of a deferred compensation arrangement for a single individual in Germany. The arrangement represents a contractual obligation to pay a fixed value, periodically adjusted for inflation, and paid in euros for a period specified in the contract. In connection with the acquisition of Orad, we assumed the assets and liabilities of a deferred compensation arrangement for employees in Israel. Our assets and
69
N. INCOME TAXES
Income before income taxes and the components of the income tax (benefit) provision consisted of the following for the years ended December 31, 2022, 2021, and 2020 (in thousands):
| Year Ended December 31, | |||||||||||||||||
| 2022 | 2021 | 2020 | |||||||||||||||
| Income from operations before income taxes: | |||||||||||||||||
| United States | $ | $ | $ | ||||||||||||||
| Foreign | |||||||||||||||||
| Total income from operations before income taxes | $ | $ | $ | ||||||||||||||
| Provision for (Benefit from) income taxes: | |||||||||||||||||
| Current tax expense (benefit): | |||||||||||||||||
| Federal | $ | $ | $ | ||||||||||||||
| State | |||||||||||||||||
| Foreign benefit of net operating losses | ( | ( | ( | ||||||||||||||
| Other foreign | |||||||||||||||||
| Total current tax expense | |||||||||||||||||
| Deferred tax (benefit) expense: | |||||||||||||||||
| Federal | |||||||||||||||||
| State | — | — | — | ||||||||||||||
| Other foreign | ( | ||||||||||||||||
| Total deferred tax (benefit) expense | ( | ||||||||||||||||
| Total (benefit from) provision for income taxes | $ | ( | $ | $ | |||||||||||||
70
Net deferred tax assets (liabilities) consisted of the following at December 31, 2022 and 2021 (in thousands):
| December 31, | |||||||||||
| 2022 | 2021 | ||||||||||
| Deferred tax assets: | |||||||||||
| Tax credit and loss carryforwards | $ | $ | |||||||||
| Allowances for bad debts | |||||||||||
| Difference in accounting for: | |||||||||||
| Revenues | |||||||||||
| Costs and expenses | |||||||||||
| Inventories | |||||||||||
| Long-term lease liabilities | |||||||||||
| Gross deferred tax assets | |||||||||||
| Valuation allowance | ( | ( | |||||||||
| Deferred tax assets after valuation allowance | |||||||||||
| Deferred tax liabilities: | |||||||||||
| Difference in accounting for: | |||||||||||
| Costs and expenses | ( | ( | |||||||||
| Inventories | ( | ||||||||||
| Right of use asset | ( | ( | |||||||||
| Gross deferred tax liabilities | ( | ( | |||||||||
| Net deferred tax assets | $ | $ | |||||||||
| Recorded as: | |||||||||||
| Deferred tax assets, net | |||||||||||
| Deferred tax liabilities, net | ( | ||||||||||
| Net deferred tax assets | $ | $ | |||||||||
Deferred tax assets and liabilities reflect the net tax effects of the tax credits and net operating loss carryforwards and the temporary differences between the carrying amounts of assets and liabilities for financial reporting purposes and the amounts used for income tax purposes. The ultimate realization of the net deferred tax assets is dependent upon the generation of sufficient future taxable income in the applicable tax jurisdictions. Management believes the remaining deferred tax assets, based largely on the long history of U.S. tax losses, warrant a valuation allowance based on the weight of available negative evidence. We have experienced recent profitability in the U.S.; however we intend to continue maintaining a full valuation allowance on our U.S. deferred tax assets until there is sufficient positive evidence to allow us to reach a conclusion that a significant portion of the valuation allowance will no longer be needed. Any such release of the valuation allowance, or a portion thereof, would result in a material non-cash income tax benefit in the quarter the realizability of the respective deferred taxes were deemed to be more likely than not and would increase non-cash income tax expense in the periods subsequent to the reversal.
For U.S. federal and state income tax purposes at December 31, 2022, we had tax credit carryforwards of $46.9 million, which will expire between 2023 and 2042, federal net operating loss carryforwards of $616.4 million and state net operating loss carryforwards of $328.1 million, the majority of which will expire between 2023 and 2037.
The federal net operating loss and tax credit amounts are subject to annual limitations under Section 382 change of ownership rules of the Internal Revenue Code. We completed an assessment at September 19, 2022 regarding whether there may have been a Section 382 ownership change and concluded that it is more likely than not that none of our net operating loss and tax credit amounts are subject to any Section 382 limitation. Our Section 382 conclusion remains unchanged at December 31, 2022.
Additionally, we have foreign net operating loss carryforwards of $107.5 million and capital loss carryforwards of $1.5 million, each with an indefinite carryforward period and tax credit carryforwards of $6.0 million that begin to expire in 2031. We have
71
determined there is uncertainty regarding the realization of a portion of these assets and have recorded a valuation allowance against $49.3 million of net operating losses, $1.5 million of capital losses and $6.0 million of tax credits at December 31, 2022.
Our assessment of the valuation allowance on the U.S. and foreign deferred tax assets could change in the future based on our levels of pre-tax income and other tax related adjustments. Reversal of the valuation allowance in whole or in part would result in a non-cash reduction in income tax expense during the period of reversal.
The following table sets forth a reconciliation of our income tax provision (benefit) to the statutory U.S. federal tax amount for the years ended December 31, 2022, 2021, and 2020:
| Year Ended December 31, | |||||||||||||||||
| 2022 | 2021 | 2020 | |||||||||||||||
| Statutory tax | $ | $ | $ | ||||||||||||||
| Tax credits utilized and expired | |||||||||||||||||
| Foreign operations | |||||||||||||||||
| Change in uncertain tax positions | ( | ( | |||||||||||||||
| Non-deductible expenses and other | |||||||||||||||||
| Stock based compensation | ( | ( | ( | ||||||||||||||
| Non-deductible executive compensation | |||||||||||||||||
| Non-taxable income from PPP loan forgiveness | ( | ||||||||||||||||
| Change in valuation allowance | ( | ( | ( | ||||||||||||||
| (Benefit from) provision for income taxes | $ | ( | $ | $ | |||||||||||||
The increase in our statutory tax is driven by the increase in our income from operations before taxes. The change in our tax credits is driven by expiring U.S. research and development tax credits exceeding current year tax credits generated. Changes in the jurisdictional mix of our foreign profitability and, in 2022, increases in our U.S. foreign income inclusion - also known as global intangible low-taxed income (GILTI) - largely driven by the 2022 U.S. tax law change requiring the capitalization of R&D costs – drives the change in the taxes on foreign operations. The 2022 decrease in our uncertain tax positions relates to the recognition of an uncertain tax benefit associated with our German subsidiary’s net operating loss carryforwards due to the expiration of the statute of limitations associated with the issue. The change in our stock-based compensation was related to the increased deduction resulting from the increase in the market value of our stock compared to the book expense determined at the grant date. The change in the non-deductible executive compensation was primarily related to the change in the value of stock compensation awarded to our executives. The decreases in our valuation allowance were primarily driven by the decreases of U.S. net deferred tax assets. In 2022 the decrease in our net deferred tax assets was driven by higher U.S. taxable income largely associated with the 2022 U.S. tax law change requiring the capitalization of R&D costs. The higher taxable income allowed us to utilize interest expense carryforward deductions and to utilize net operating losses that would have expired in 2022 and 2023. These deferred tax asset utilizations were largely, but not entirely, substituted with new deferred tax assets representing future R&D amortization deductions.
As a result of Tax Cuts and Jobs Act (TCJA) and the current U.S. taxation of deemed repatriated earnings, the additional taxes that might be payable upon repatriation of foreign earnings are not significant. However, we do not have any current plans to repatriate these earnings because the underlying cash will be used to fund the ongoing operations of the foreign subsidiaries.
A tax position must be more likely than not to be sustained before being recognized in the financial statements. It also requires the accrual of interest and penalties as applicable on unrecognized tax positions. At January 1, 2020, our unrecognized tax benefits and related accrued interest and penalties related to an audit issue at our subsidiary in Israel in the amount of $1.8 million and $11.2 million related to German net operating loss carryforwards utilizable in our subsequently reorganized German subsidiary. During 2020, we reversed the accrual for the unrecognized tax position related to the audit issue at our subsidiary in Israel due to the settlement of the issue. The total decreases to the value of our unrecognized tax benefits during 2020, including the impacts of any foreign currency revaluations, were $(0.8 ) million. The balance of the unrecognized benefit at December 31, 2020 relates only to the unrecognized tax position related to our German subsidiary net operating loss carryforward. During 2021, we had a decrease in our unrecognized tax positions of $(0.5 ) million of which $0.4 million related to a withholding tax issue in our Irish subsidiary and $(0.9 ) million related to foreign currency revaluations. During 2022, the decrease of $11.2 million was primarily due to the expiration of the statute of limitations associated with net operating loss carryforwards at our German subsidiary. The
72
balance of the unrecognized benefit at December 31, 2022 relates only Irish withholding tax issue, which would not affect our income tax provision or effective rate if recognized.
The following table sets forth a reconciliation of the beginning and ending amounts of unrecognized tax benefits for the years ended December 31, 2022, 2021, and 2020 (in thousands):
Unrecognized tax benefits at January 1, 2020 | $ | ||||
| Decreases for tax positions taken during a prior period | ( | ||||
Unrecognized tax benefits at December 31, 2020 | |||||
| Decreases for tax positions taken during a prior period | ( | ||||
Unrecognized tax benefits at December 31, 2021 | |||||
| Decreases due to expiration of statute of limitations | ( | ||||
Unrecognized tax benefits at December 31, 2022 | $ | ||||
We recognize interest and penalties related to uncertain tax positions in income tax expense. There were no accrued interest and penalties related to uncertain tax positions at December 31, 2022 and 2021.
The tax years 2011 and forward remain open to examination by taxing authorities in the jurisdictions in which we operate. The most significant operating jurisdictions include: the United States, Ireland, the Netherlands, Germany, Israel, Japan, and the United Kingdom.
O. RESTRUCTURING COSTS AND ACCRUALS
2020 Restructuring Plan
In October 2020, we committed to a restructuring plan in order to undergo a strategic reorganization of our business. We are making significant changes in business operations to better support our strategy and overall performance. The 2020 restructuring plan is complete as of December 31, 2022.
During the year ended December 31, 2022, we recorded restructuring costs of $0.5 million. The restructuring charges for the year ended December 31, 2022 were a result of severance costs related to approximately three positions eliminated during 2022.
During the year ended December 31, 2021, we recorded restructuring costs of $1.1 million. The restructuring charges for the year ended December 31, 2021 were a result of severance costs related to approximately 24 positions eliminated during 2021.
During the year ended December 31, 2020, we recorded restructuring costs of $5 million. The restructuring charges for the year ended December 31, 2020 were a result of severance costs related to approximately 93 positions eliminated during 2020.
73
Restructuring Summary
The following table sets forth restructuring expenses recognized for the years ended December 31, 2022, 2021, and 2020 (in thousands):
| Year Ended December 31, | |||||||||||||||||
2022 | 2021 | 2020 | |||||||||||||||
| Employee | $ | $ | $ | ||||||||||||||
| Facility | |||||||||||||||||
| Total restructuring charges, net | $ | $ | $ | ||||||||||||||
The following table sets forth the activity in the restructuring accruals for the years ended December 31, 2022, 2021, and 2020 (in thousands).
| Employee- Related | |||||
Accrual balance at December 31, 2019 | $ | ||||
| Restructuring charges and revisions | |||||
| Cash payments | ( | ||||
| Foreign exchange impact on ending balance | |||||
Accrual balance at December 31, 2020 | |||||
| Restructuring charges and revisions | |||||
| Cash payments | ( | ||||
| Foreign exchange impact on ending balance | ( | ||||
Accrual balance at December 31, 2021 | $ | ||||
| Restructuring charges and revisions | |||||
| Cash payments | ( | ||||
| Foreign exchange impact on ending balance | ( | ||||
Current accrual balance at December 31, 2022 | $ | ||||
The employee-related accruals at December 31, 2022 represent severance costs to former employees that will be paid out within 12 months, and are, therefore, included in the caption “” in our consolidated balance sheets.
P. REVENUE
Revenue Components and Performance Obligations
Subscription Services
We offer subscription versions of many of our software products with monthly, annual and multi-year terms. While we are beginning to offer subscription versions for most of our product portfolio in connection with our cloud strategy, current subscription sales primarily consist of our Media Composer, Pro Tools, and Sibelius offerings. We sell these products to customers under standard terms and conditions and payment is due upfront, except for webstore transactions which are typically billed monthly. Contract assets for annual and multi-year subscriptions billed monthly are recorded on our balance sheet upon customer commitment, net of expected early cancellations where we estimate variable consideration based on historical experience. Subscription services have several performance obligations, including a right to use the software and stand-ready
74
performance obligations to (i) provide unspecified bug fixes and software enhancements, or Software Updates, and (ii) call support when and if needed. The allocated revenue related to the right to use the licensed software is recognized at a point in time once control has been transferred and the customer has the ability to access the software. Stand-ready performance obligations related to Software Updates and call support are satisfied over time and revenue is recognized ratably over the term of the subscription.
Maintenance Services
We offer maintenance contracts, which are typically annual, for our integrated solutions. Maintenance contracts for individual products are sold bundled with initial product offerings or as renewals once initial contracts have lapsed. Maintenance contracts are also sold on an enterprise basis where a customer purchases maintenance for all Avid products owned. Maintenance contracts are provided under our standard terms and conditions and payment is due in advance of the maintenance being provided. Maintenance contracts include stand-ready performance obligations to provide (i) Software Updates, (ii) call support, and (iii) hardware maintenance. Maintenance contract performance obligations are satisfied over time and revenue is recognized ratably over the term of the contract.
Historically, for many of our products, we had an ongoing practice of making when-and-if-available Software Updates available to customers free of charge for a period of time after initial sales to customers. The expectation created by this practice represents an implied performance obligation of a form of post-contract maintenance support (“Implied Maintenance Release PCS”) which represents a performance obligation. While we have ceased providing Implied Maintenance Release PCS on new product offerings, we continue to provide Implied Maintenance Release PCS for older products that were predominately sold in prior years. Revenue attributable to Implied Maintenance Release PCS performance obligations is recognized over time on a ratable basis over the period that Implied Maintenance Release PCS is expected to be provided, which is typically six years.
Integrated Solutions
We offer a wide range of video and audio products and solutions. Our video solutions consist of storage and workflow solutions, our media management solutions, and our video creative tools, which include our Media Composer, NEXIS, Airspeed, Maestro, and MediaCentral product lines that consist of software licenses or integrated hardware and software solutions. Our audio solutions consist of sales of digital audio software and workstation solutions and our control surfaces, consoles and live-sound systems, which include our Pro Tools, Pro Tools HD, Pro Tools | S6, VENUE | S6L, and Sibelius product lines that consist of software licenses or integrated hardware and software solutions. We sell these products to customers under a contract or signed quote and payment terms are generally 30 to 60 days from delivery. Each individual product sold to a customer represents a distinct performance obligation for us and revenue is recognized at the point in time when control of the product transfers, which is typically when the product is shipped to the customer or, in the case of certain software licenses, when the software license term commences and is accessible by the customer.
Professional Services, Training, and Other
We sell a variety of professional services, training, and other services that complement product and maintenance offerings. Professional services consist primarily of standard configuration, commissioning (i.e., setting up equipment purchased) and on-air support (i.e., monitoring a customer’s production environment available during initial system go-live, live sporting events, etc.) and providing customization services for some of our products. We also offer training and certification programs for many of our products and workflows. Other revenues include shipping and handling charges and reimbursable travel expenses. We sell professional services, training and other services under a contract or signed quote, and for larger projects, statements of work that outline the customer’s specifications and requirements. Services are primarily sold on a time and materials basis, however, fixed fee arrangements are also executed from time to time. Payments are generally billed upon completion of the service or, for larger projects, on an installment basis as services are rendered. While the nature of service deliverables can vary significantly, each service deliverable generally represents a distinct performance obligation and revenue is recognized over time, typically in proportion of the total hours incurred as a percentage of total estimated hours required to complete the project.
Enterprise Agreements
From time to time, we enter into enterprise wide agreements whereby the customer agrees to purchase specified products and services from us over an extended period of time, often for a single fixed contractual price. For such agreements, management
75
identifies each performance obligation in the contract and allocates the total contract price to each performance obligation based on relative estimated SSP. Once the transaction price is allocated to individual performance obligations, the components are recognized in the respective categories of revenue above consistent with the timing of the recognition of performance obligations described therein.
Disaggregated Revenue and Geography Information
The following is a summary of our revenues by type for the years ended December 31, 2022, 2021, and 2020 (in thousands):
| Year Ended December 31, | |||||||||||||||||
| 2022 | 2021 | 2020 | |||||||||||||||
| Subscription services | $ | $ | $ | ||||||||||||||
| Maintenance services | |||||||||||||||||
| Integrated solutions | |||||||||||||||||
| Perpetual Licenses | |||||||||||||||||
| Professional services, training and other services | |||||||||||||||||
| Total net revenues | $ | $ | $ | ||||||||||||||
The following table sets forth our revenues by geographic region for the years ended December 31, 2022, 2021, and 2020 (in thousands):
| Year Ended December 31, | |||||||||||||||||
| 2022 | 2021 | 2020 | |||||||||||||||
| Revenues: | |||||||||||||||||
| United States | $ | $ | $ | ||||||||||||||
| Other Americas | |||||||||||||||||
| Europe, Middle East and Africa | |||||||||||||||||
| Asia-Pacific | |||||||||||||||||
| Total net revenues | $ | $ | $ | ||||||||||||||
Contract Asset
Contract asset activity for the years ended December 31, 2022 and 2021 was as follows (in thousands):
| December 31, 2022 | December 31, 2021 | ||||||||||
| Contract asset at beginning of period | $ | $ | |||||||||
| Revenue in excess of billings | |||||||||||
| Customer billings | ( | ( | |||||||||
| Contract asset at end of period | |||||||||||
| Less: current portion | |||||||||||
| Long-term portion | $ | $ | |||||||||
The increase in contract assets during the year ended December 31, 2022 is due to the timing of payments due under our enterprise network agreements which predominately are payable annually, whereas performance obligations are fulfilled on a continuous basis partially offset by continued growth in our subscription offerings. The long-term portion of contract assets is included in “other long-term assets” in our consolidated balance sheet for the year ended December 31, 2022.
Deferred Revenue
Deferred revenue activity for the years ended December 31, 2022 and 2021 was as follows (in thousands):
76
| December 31, 2022 | December 31, 2021 | ||||||||||
| Deferred revenue at beginning of period | $ | $ | |||||||||
| Billings deferred | |||||||||||
| Recognition of prior deferred revenue | ( | ( | |||||||||
| Deferred revenue at end of period | $ | $ | |||||||||
A summary of the performance obligations included in deferred revenue as of December 31, 2022 is as follows (in thousands):
| December 31, 2022 | |||||
| Product | $ | ||||
| Subscription | |||||
| Maintenance Contracts | |||||
| Implied Maintenance Release PCS | |||||
| Professional services, training and other | |||||
Deferred revenue at December 31, 2022 | $ | ||||
Remaining Performance Obligations
For transaction prices allocated to remaining performance obligations, we apply practical expedients and do not disclose quantitative or qualitative information for remaining performance obligations (i) that have original expected durations of one year or less and (ii) where we recognize revenue equal to what we have the right to invoice and that amount corresponds directly with the value to the customer of our performance to date.
We have remaining performance obligations of $4.0 million attributable to Implied Maintenance Release PCS recorded in deferred revenue as of December 31, 2022. We expect to recognize revenue for these remaining performance obligations of $1.6 million, $1.1 million, $0.7 million, $0.4 million, and $0.2 million for the years ended December 31, 2023, 2024, 2025, 2026, and 2027, respectively, and an immaterial amount thereafter.
As of December 31, 2022, we had approximately $20.4 million of transaction price allocated to remaining performance obligations for certain enterprise agreements that have not yet been invoiced and are therefore not recorded as deferred revenue on our balance sheet. Unbilled remaining performance obligations represent obligations we have to deliver for specific products and services in the future where there is not yet an enforceable right to invoice the customer. Our unbilled remaining performance obligations do not include contractually committed minimum purchases that are common in our strategic purchase agreements with resellers since our specific obligations to deliver products or services is not yet known, as customers may satisfy such commitments by purchasing an unknown combination of current or future product offerings. While the timing of fulfilling individual performance obligations under the contracts can vary based on customer requirements, we expect to recognize the $24.4 million in installments through 2027.
Remaining performance obligation estimates are subject to change and are affected by several factors, including terminations due to contract breach, contract amendments and changes in the expected timing of delivery.
77
Q. LONG-TERM DEBT AND CREDIT AGREEMENT
Long-term debt consisted of the following (in thousands):
| December 31, 2022 | December 31, 2021 | ||||||||||
Term loan, net of unamortized debt issuance costs and debt discount of $ | $ | $ | |||||||||
| Other long-term debt | |||||||||||
| Total debt | |||||||||||
| Less: current portion | |||||||||||
| Total long-term debt | $ | $ | |||||||||
The following table summarizes the maturities of our borrowing obligations as of December 31, 2022 (in thousands):
| Fiscal Year | Term Loan | Other Long-Term Debt | Total | |||||||||||||||||
| 2023 | $ | $ | $ | |||||||||||||||||
| 2024 | ||||||||||||||||||||
| 2025 | ||||||||||||||||||||
| 2026 | ||||||||||||||||||||
| 2027 | ||||||||||||||||||||
| Thereafter | ||||||||||||||||||||
Total before unamortized discount | ||||||||||||||||||||
| Less: unamortized discount and issuance costs | ( | ( | ||||||||||||||||||
Less: current portion of long-term debt | ( | ( | ( | |||||||||||||||||
| Total long-term debt | $ | $ | $ | |||||||||||||||||
Credit Agreement
On January 5, 2021, the Company entered into a Credit Agreement (the “Credit Agreement”) with JPMorgan Chase Bank, N.A. as collateral and administrative agent, and a syndicate of banks, as lenders thereunder (the “Lenders”). Pursuant to the Credit Agreement, the Lenders agreed to provide the Company with (a) a term loan in the aggregate principal amount of $180.0 million (the “Term Loan”) and (b) a revolving credit facility (the “Revolving Credit Facility”) of up to a maximum of $70.0 million in borrowings outstanding at any time. The Revolving Credit Facility, which was undrawn at closing, can be used for working capital, other general corporate purposes and for other permitted uses. The proceeds from the Term Loan, plus available cash on hand, were used to repay outstanding borrowings in the principal amount of $201 million under the Company’s prior financing agreement with Cerberus Business Finance, LLC, which was then terminated. As a result of this termination, the Company incurred a loss on extinguishment of debt of $3.7 million as a result of writing off $2.6 million of remaining unamortized issuance costs as well as a $1.1 million prepayment penalty.
In connection with the Credit Agreement, the Company incurred $2.5 million of issuance discounts and an immaterial amount of issuance costs. The Term Loan discount and issuance costs will be amortized over the remaining life of the Second A&R Credit Agreement.
On February 25, 2022, the Company executed an Amended and Restated Credit Agreement (the “A&R Credit Agreement) with JPMorgan Chase Bank, N.A. and the Lenders. The A&R Credit Agreement extended the term of the Term Loan to February 25, 2027, reduced the applicable interest rate margins by 0.25 %, removed the LIBOR floor, moved the reference rate from LIBOR to the Secured Overnight Financing Rate (“SOFR”), reset the principal amortization schedule, and eliminated the fixed charge coverage ratio.
78
In connection with the A&R Credit Agreement, the Company accounted for the amendment as a modification and incurred an additional $0.4 million of issuance costs during the three months ended March 31, 2022. These additional costs and the remaining unamortized Term Loan discount and issuance costs will be amortized jointly over the amended remaining life of the Second A&R Credit Agreement.
On October 6, 2022, the Company executed a Second Amended and Restated Credit Agreement (the “Second A&R Credit Agreement”) with JPMorgan Chase Bank, N.A. and the Lenders. Pursuant to the Second A&R Credit Agreement, the Lenders agreed to provide the Company with (a) an additional term loan in the aggregate principal amount of $20 million (of which approximately $19 million was used to pay off the Company’s outstanding drawings under the Revolving Credit Facility), and (b) an additional $50 million of available borrowing capacity under the Revolving Credit Facility, increasing the aggregate amount available to $120.0 million. The Second A&R Credit Agreement, which replaces the Company’s existing A&R Credit Agreement, includes substantially similar terms and does not result in any changes to financial covenants, pricing or the maturity date of February 25, 2027.
In connection with the Second A&R Credit Agreement, the Company accounted for the amendment as a modification and incurred an additional $0.5 million of issuance costs during the three months ended December 31, 2022. These additional costs and the remaining unamortized Term Loan discount and issuance costs will be amortized jointly over the amended remaining life of the Second A&R Credit Agreement.
We recorded $7.8 million of interest expense on the Term Loan and Revolving Credit Facility for the twelve months ended December 31, 2022. The effective interest rate for the twelve months ended December 31, 2022 was 4.43 %. As of December 31, 2022, there were no amounts drawn under the Revolving Credit Facility. We were in compliance with the Second A&R Credit Agreement covenants as of December 31, 2022.
.
79
ITEM 9.CHANGES IN AND DISAGREEMENTS WITH ACCOUNTANTS ON ACCOUNTING AND FINANCIAL DISCLOSURE
Not Applicable.
ITEM 9A. CONTROLS AND PROCEDURES
Disclosure Controls and Procedures
Our management, with the participation and supervision of our Chief Executive Officer and Chief Financial Officer, is responsible for our disclosure controls and procedures pursuant to Rules 13a-15(e) and 15d-15(e) under the Exchange Act. Disclosure controls and procedures are controls and other procedures that are designed to ensure that information required to be disclosed in our reports filed or submitted under the Exchange Act is recorded, processed, summarized and reported, within the time periods specified under SEC rules and forms. Disclosure controls and procedures include controls and procedures designed to ensure that information required to be disclosed in our reports filed under the Exchange Act is accumulated and communicated to our principal executive officer and our principal financial officer, as appropriate, to allow timely decisions regarding required disclosure.
Our management, including the Chief Executive Officer and the Chief Financial Officer, carried out an evaluation of the effectiveness of our disclosure controls and procedures as of December 31, 2022. Management recognizes that any controls and procedures, no matter how well designed and operated, can provide only reasonable assurance of achieving their objectives and management necessarily applies its judgment in evaluating the cost-benefit relationship of possible controls and procedures. Based on this evaluation, our management concluded that, as of December 31, 2022, these disclosure controls and procedures were not effective at a reasonable level of assurance as a result of the material weakness in internal control over financial reporting that existed as of such date, as described in greater detail below.
Management's Annual Report on Internal Control over Financial Reporting
Our management is responsible for establishing and maintaining adequate internal control over financial reporting, as defined in Rule 13a-15(f) under the Exchange Act. Internal control over financial reporting is a process designed by, or under the supervision of, our principal executive and principal financial officers, or persons performing similar functions, and effected by our board of directors, management, and other personnel, to provide reasonable assurance regarding the reliability of financial reporting and the preparation of financial statements for external purposes in accordance with GAAP and includes those policies and procedures that:
(1)pertain to the maintenance of records that, in reasonable detail, accurately and fairly reflect the transactions and dispositions of our assets;
(2)provide reasonable assurance that transactions are recorded as necessary to permit preparation of financial statements in accordance with GAAP, and our receipts and expenditures are being made only in accordance with authorizations of our management and directors; and
(3)provide reasonable assurance regarding prevention or timely detection of unauthorized acquisition, use or disposition of our assets that could have a material effect on the financial statements.
Because of inherent limitations, no matter how well designed and operated, internal control over financial reporting may not prevent or detect misstatements and can only provide reasonable assurance of achieving the desired control objectives. In addition, the design of internal control over financial reporting must reflect the fact that there are resource constraints and that management is required to apply its judgment in evaluating the benefits of possible controls and procedures relative to their costs.
Our Chief Executive Officer and Chief Financial Officer have performed an evaluation of our internal control over financial
reporting under the framework in Internal Control-Integrated Framework (2013), issued by the Committee of Sponsoring
Organizations of the Treadway Commission. The objective of this assessment was to determine whether our internal control over
80
financial reporting was effective at December 31, 2022. Based on the results of this evaluation, we have concluded that our internal control over financial reporting was not effective at December 31, 2022 as a result of the material weakness described below.
A material weakness is a deficiency, or combination of deficiencies, in internal control over financial reporting such that there is a reasonable possibility that a material misstatement of the company's annual or interim financial statements will not be prevented or detected on a timely basis.
A material weakness was identified related to the controls associated with the accounting methodology used to determine the appropriate allocation, amount and timing of relative estimated standalone selling price, or SSP, revenue associated with multiple performance obligations related to term-based subscription contracts.
Determining SSP involves management judgment, considering among other factors the likely price that would have resulted from established historic pricing practices and the prices a customer would likely be willing to pay. Our mix of subscription contracts shifted in 2021, and continued to shift in 2022, towards enterprise customers, but we did not adjust the SSP estimation methodology used to determine the allocation of the transaction price arrangements between the license and maintenance. This caused a material weakness in the controls related to the estimation methodology used to account for revenue at December 31, 2022, which we identified during the close process in the fourth quarter of 2022.
There were no material misstatements in any prior period financial statements as a result of the material weakness discussed above. If not remediated, or if we identify further material weaknesses in our internal control, our failure to establish and maintain effective disclosure controls and procedures and internal control over financial reporting could result in material misstatements in our consolidated financial statements or a failure to meet our reporting and financial obligations.
Our independent registered public accounting firm, BDO USA, LLP, has audited our consolidated financial statements and has issued an attestation report on our internal control over financial reporting as of December 31, 2022, which report is included herein.
Management’s Plan to Remediate the Material Weakness
Management, with oversight from the Audit Committee of our Board of Directors, has initiated a plan to remediate the material weakness. We have updated the SSP methodology to include consideration for term-based subscription contracts. We will also consider this material weakness when assessing control design as part of SOX planning for the year-end 2023 and future years.
Management is committed to successfully implementing the remediation plan as promptly as possible. Following our design and implementation of our remediation efforts, we will need to demonstrate their operating effectiveness. We will not be able to consider the material weakness remediated until the applicable remedial controls operate for a sufficient period of time and our management has concluded, through testing, that our controls are operating effectively.
Changes in Internal Control over Financial Reporting
Other than related to the change outlined above to remediate the material weakness described above, there were no changes in our internal control over financial reporting during the quarter ended December 31, 2022 that have materially affected, or are reasonably likely to materially affect, our internal control over financial reporting.
Inherent Limitation on the Effectiveness of Internal Controls
The effectiveness of any system of internal control over financial reporting is subject to inherent limitations, including the exercise of judgment in designing, implementing, operating, and evaluating the controls and procedures, and the inability to eliminate misconduct completely. Accordingly, any system of internal control over financial reporting can only provide reasonable, not absolute, assurances. In addition, projections of any evaluation of effectiveness to future periods are subject to the risk that controls may become inadequate because of changes in conditions, or that the degree of compliance with the policies or procedures may deteriorate. We intend to continue to monitor and upgrade our internal controls as necessary or appropriate for our business, but cannot assure that such improvements will be sufficient to provide us with effective internal control over financial reporting.
81
REPORT OF INDEPENDENT REGISTERED PUBLIC ACCOUNTING FIRM
Stockholders and Board of Directors
Avid Technology, Inc.
Burlington, Massachusetts
Opinion on Internal Control over Financial Reporting
We have audited Avid Technology, Inc. and subsidiaries’ (the “Company’s”) internal control over financial reporting as of December 31, 2022, based on criteria established in Internal Control – Integrated Framework (2013) issued by the Committee of Sponsoring Organizations of the Treadway Commission (the “COSO criteria”). In our opinion, the Company did not maintain, in all material respects, effective internal control over financial reporting as of December 31, 2022, based on the COSO criteria.
We also have audited, in accordance with the standards of the Public Company Accounting Oversight Board (United States) (“PCAOB”), the consolidated balance sheets of the Company as of December 31, 2022 and 2021, the related consolidated statements of operations, comprehensive income, stockholders’ deficit, and cash flows for each of the three years in the period ended December 31, 2022, and the related notes (collectively referred to as “the financial statements”) and our report dated March 1, 2023 expressed an unqualified opinion thereon.
Basis for Opinion
The Company’s management is responsible for maintaining effective internal control over financial reporting and for its assessment of the effectiveness of internal control over financial reporting, included in the accompanying “Item 9A, Management’s Annual Report on Internal Control over Financial Reporting”. Our responsibility is to express an opinion on the Company’s internal control over financial reporting based on our audit. We are a public accounting firm registered with the PCAOB and are required to be independent with respect to the Company in accordance with U.S. federal securities laws and the applicable rules and regulations of the Securities and Exchange Commission and the PCAOB.
We conducted our audit of internal control over financial reporting in accordance with the standards of the PCAOB. Those standards require that we plan and perform the audit to obtain reasonable assurance about whether effective internal control over financial reporting was maintained in all material respects. Our audit included obtaining an understanding of internal control over financial reporting, assessing the risk that a material weakness exists, and testing and evaluating the design and operating effectiveness of internal control based on the assessed risk. Our audit also included performing such other procedures as we considered necessary in the circumstances. We believe that our audit provides a reasonable basis for our opinion.
A material weakness is a deficiency, or a combination of deficiencies, in internal control over financial reporting, such that there is a reasonable possibility that a material misstatement of the company’s annual or interim financial statements will not be prevented or detected on a timely basis. A material weakness regarding management’s failure to design and maintain controls over the determination of standalone selling price relative to term-based subscription contracts has been identified and described in management’s assessment. This material weakness was considered in determining the nature, timing, and extent of audit tests applied in our audit of the 2022 financial statements, and this report does not affect our report dated March 1, 2023 on those financial statements.
Definition and Limitations of Internal Control over Financial Reporting
A company’s internal control over financial reporting is a process designed to provide reasonable assurance regarding the reliability of financial reporting and the preparation of financial statements for external purposes in accordance with generally accepted accounting principles. A company’s internal control over financial reporting includes those policies and procedures that (1) pertain to the maintenance of records that, in reasonable detail, accurately and fairly reflect the transactions and dispositions of the assets of the company; (2) provide reasonable assurance that transactions are recorded as necessary to permit preparation of financial statements in accordance with generally accepted accounting principles, and that receipts and expenditures of the company are being made only in accordance with authorizations of management and directors of the company; and (3) provide reasonable assurance regarding prevention or timely detection of unauthorized acquisition, use, or disposition of the company’s assets that could have a material effect on the financial statements.
82
Because of its inherent limitations, internal control over financial reporting may not prevent or detect misstatements. Also, projections of any evaluation of effectiveness to future periods are subject to the risk that controls may become inadequate because of changes in conditions, or that the degree of compliance with the policies or procedures may deteriorate.
/s/ BDO USA, LLP
Boston, Massachusetts
March 1, 2023
ITEM 9B.OTHER INFORMATION
Not Applicable.
ITEM 9C. DISCLOSURE REGARDING FOREIGN JURISDICTIONS THAT PREVENT INSPECTIONS
Not Applicable.
83
PART III
ITEM 10.DIRECTORS, EXECUTIVE OFFICERS AND CORPORATE GOVERNANCE
We have adopted a Code of Business Conduct and Ethics applicable to all our employees, including our principal executive officer, principal financial officer, and principal accounting officer. We will provide any person, without charge, with a copy of our Code of Business Conduct and Ethics upon written request to Avid, 75 Blue Sky Drive, Burlington, MA 01803, Attention: Corporate Secretary. Our Code of Business Conduct and Ethics is also available in the Investor Relations section of our website at www.avid.com. If we were to amend or waive any provision of our Code of Business Conduct and Ethics applicable to any of our principal executive officers, our principal financial officer, our principal accounting officer, or any person performing similar functions, we intend to satisfy our disclosure obligations with respect to any such waiver or amendment by posting such information on our Internet website set forth above rather than by filing a Form 8-K.
The remainder of the response to this item will be contained in our Proxy Statement for our 2023 Annual Meeting of Stockholders, or the 2023 Proxy Statement, under the captions “Directors,” “Executive Officers,” “Delinquent 16(a) Reports,” “Board Committees,” and “Director Nomination Process,” all of which is incorporated herein by reference.
ITEM 11. EXECUTIVE COMPENSATION
The response to this item will be contained in our 2023 Proxy Statement under the captions “Director Compensation,” “Executive Compensation,” “Compensation Committee Report,” and “Compensation Committee Interlocks and Insider Participation” and is incorporated herein by reference.
ITEM 12.SECURITY OWNERSHIP OF CERTAIN BENEFICIAL OWNERS AND MANAGEMENT AND RELATED STOCKHOLDER MATTERS
The response to this item will be contained in our 2023 Proxy Statement under the caption “Security Ownership of Certain Beneficial Owners and Management” and is incorporated herein by reference.
The disclosures required for securities authorized for issuance under equity compensation plans will be contained in the 2023 Proxy Statement under the caption “Equity Compensation Plan Information” and are incorporated herein by reference.
ITEM 13.CERTAIN RELATIONSHIPS AND RELATED TRANSACTIONS, AND DIRECTOR INDEPENDENCE
The response to this item will be contained in our 2023 Proxy Statement under the captions “Board Committees” and “Related Person Transaction Policy” and is incorporated herein by reference.
ITEM 14.PRINCIPAL ACCOUNTANT FEES AND SERVICES
The response to this item will be contained in our 2023 Proxy Statement under the caption “Independent Registered Public Accounting Firm Fees” and is incorporated herein by reference.
84
PART IV
ITEM 15.EXHIBITS AND FINANCIAL STATEMENT SCHEDULES
| (a) 1. | FINANCIAL STATEMENTS | ||||
The following consolidated financial statements are included in Item 8:
- Reports of Independent Registered Public Accounting Firms
- Consolidated Statements of Operations for the years ended December 31, 2022, 2021, and 2020
- Consolidated Statements of Comprehensive Income (Loss) for the years ended December 31, 2022, 2021, and 2020
- Consolidated Balance Sheets as of December 31, 2022 and 2021
- Consolidated Statements of Stockholders’ Deficit for the years ended December 31, 2022, 2021, and 2020
- Consolidated Statements of Cash Flows for the years ended December 31, 2022, 2021, and 2020
- Notes to Consolidated Financial Statements
| (a) 3. | LISTING OF EXHIBITS. The list of exhibits, which are filed or furnished with this report or are incorporated herein by reference, is set forth in the Exhibit Index immediately preceding the exhibits and is incorporated herein by reference. | ||||
85
EXHIBIT INDEX
| Incorporated by Reference | ||||||||||||||||||||||||||||||||
| Exhibit No. | Description | Filed with this Form 10-K | Form or Schedule | SEC Filing Date | SEC File Number | |||||||||||||||||||||||||||
| 3.1 | 8-K | July 27, 2005 | 000-21174 | |||||||||||||||||||||||||||||
| 3.2 | 10-Q | November 14, 2005 | 000-21174 | |||||||||||||||||||||||||||||
| 3.3 | 8-K | October 21, 2011 | 000-21174 | |||||||||||||||||||||||||||||
| 3.4 | 10-K | March 9, 2020 | 001-36254 | |||||||||||||||||||||||||||||
| 4.1 | Specimen Certificate representing the Registrant’s Common Stock | S-1 | March 11, 1993* | 033-57796 | ||||||||||||||||||||||||||||
| 4.2 | Rights Agreement, dated as of January 6, 2014, between Registrant and Computershare Trust Company, N.A. as Rights Agent, including all exhibits thereto | 8-K | January 7, 2014 | 000-21174 | ||||||||||||||||||||||||||||
| 4.2 | 8-K | January 7, 2014 | 000-21174 | |||||||||||||||||||||||||||||
| 4.3 | 10-K | March 9, 2020 | 001-36254 | |||||||||||||||||||||||||||||
| 10.1 | 8-K | November 25, 2009 | 000-21174 | |||||||||||||||||||||||||||||
| 10.2 | 8-K | November 25, 2009 | 000-21174 | |||||||||||||||||||||||||||||
| #10.3 | 10-K | February 29, 2008 | 000-21174 | |||||||||||||||||||||||||||||
| #10.4 | 10-K | March 16, 2010 | 000-21174 | |||||||||||||||||||||||||||||
| #10.5 | 10-K | September 12, 2014 | 001-36254 | |||||||||||||||||||||||||||||
| #10.6 | 1997 Stock Option Plan | 10-K | March 27, 1998 | 000-21174 | ||||||||||||||||||||||||||||
| #10.7 | 1997 Stock Incentive Plan, as amended | 10-Q | May 14, 1997 | 000-21174 | ||||||||||||||||||||||||||||
| #10.8 | 10-K | February 29, 2008 | 000-21174 | |||||||||||||||||||||||||||||
| #10.9 | 10-K | March 16, 2005 | 000-21174 | |||||||||||||||||||||||||||||
| #10.10 | 10-K | March 16, 2005 | 000-21174 | |||||||||||||||||||||||||||||
| #10.11 | 10-Q | August 7, 2008 | 000-21174 | |||||||||||||||||||||||||||||
| #10.12 | 10-K | September 12, 2014 | 001-36254 | |||||||||||||||||||||||||||||
| #10.13 | 10-K | September 12, 2014 | 001-36254 | |||||||||||||||||||||||||||||
86
| #10.14 | 10-K | September 12, 2014 | 001-36254 | |||||||||||||||||||||||||||||
| #10.15 | 8-K | July 8, 2008 | 000-21174 | |||||||||||||||||||||||||||||
| #10.16 | 8-K | July 8, 2008 | 000-21174 | |||||||||||||||||||||||||||||
| #10.17 | 8-K | July 8, 2008 | 000-21174 | |||||||||||||||||||||||||||||
| #10.18 | 8-K | July 8, 2008 | 000-21174 | |||||||||||||||||||||||||||||
| #10.19 | 8-K | February 21, 2007 | 000-21174 | |||||||||||||||||||||||||||||
| #10.20 | 8-K | February 21, 2007 | 000-21174 | |||||||||||||||||||||||||||||
| #10.21 | 10-K | March 16, 2015 | 001-36254 | |||||||||||||||||||||||||||||
| #10.22 | 10-K | March 16, 2015 | 001-36254 | |||||||||||||||||||||||||||||
| #10.23 | 10-K | March 16, 2015 | 001-36254 | |||||||||||||||||||||||||||||
| #10.24 | 10-K | March 16, 2015 | 001-36254 | |||||||||||||||||||||||||||||
| #10.25 | 10-K | February 29, 2012 | 000-21174 | |||||||||||||||||||||||||||||
| #10.26 | 10-K | September 12, 2014 | 001-36254 | |||||||||||||||||||||||||||||
| #10.27 | 8-K | July 25, 2013 | 000-21174 | |||||||||||||||||||||||||||||
| #10.28 | 10-Q | September 23, 2014 | 001-36254 | |||||||||||||||||||||||||||||
| 10.29 | 8-K | April 13, 2015 | 001-36254 | |||||||||||||||||||||||||||||
| 10.30 | 8-K | April 13, 2015 | 001-36254 | |||||||||||||||||||||||||||||
| #10.31 | 10-Q | May 8, 2015 | 001-36254 | |||||||||||||||||||||||||||||
| 10.32 | 8-K/A | June 16, 2015 | 001-36254 | |||||||||||||||||||||||||||||
| 10.33 | 8-K/A | June 16, 2015 | 001-36254 | |||||||||||||||||||||||||||||
87
| #10.34 | 10-Q | November 6, 2015 | 001-36254 | |||||||||||||||||||||||||||||
| 10.35 | 10-K | March 15, 2016 | 001-36254 | |||||||||||||||||||||||||||||
| 10.36 | 8-K | March 20, 2017 | 001-36254 | |||||||||||||||||||||||||||||
| 10.37 | 8-K | February 21, 2018 | 001-36254 | |||||||||||||||||||||||||||||
| 10.38 | 10-K | March 16, 2018 | 001-36254 | |||||||||||||||||||||||||||||
| 10.39 | 10-K | March 16, 2018 | 001-36254 | |||||||||||||||||||||||||||||
| 10.40 | 8-K | May 15, 2018 | 001-36254 | |||||||||||||||||||||||||||||
| 10.41 | 8-K | December 7, 2018 | 001-36254 | |||||||||||||||||||||||||||||
| 10.42 | 8-K | December 7, 2018 | 001-36254 | |||||||||||||||||||||||||||||
| 10.43 | 8-K | April 11, 2019 | 001-36254 | |||||||||||||||||||||||||||||
| 10.44 | 8-K | May 7, 2020 | 001-35254 | |||||||||||||||||||||||||||||
| 10.45 | 10-Q | May 7, 2020 | 001-35254 | |||||||||||||||||||||||||||||
| 10.46 | 10-Q | May 7, 2020 | 001-35254 | |||||||||||||||||||||||||||||
| 10.47 | 10-Q | May 7, 2020 | 001-35254 | |||||||||||||||||||||||||||||
| 10.48 | 10-Q | May 7, 2020 | 001-35254 | |||||||||||||||||||||||||||||
| 10.49 | 8-K | May 19, 2020 | 001-36254 | |||||||||||||||||||||||||||||
88
| 10.50 | 8-K | January 5, 2021 | 001-36254 | |||||||||||||||||||||||||||||
| 10.51 | 8-K | March 17, 2021 | 001-36254 | |||||||||||||||||||||||||||||
| 10.52 | 8-K | September 10, 2021 | 001-36254 | |||||||||||||||||||||||||||||
| 10.52 | 10-K | March 1, 2022 | 001-36254 | |||||||||||||||||||||||||||||
| 10.53 | 8-K | October 13, 2022 | 001-36254 | |||||||||||||||||||||||||||||
| 10.54 | 10-K | March 1, 2022 | 001-36254 | |||||||||||||||||||||||||||||
| 21 | X | |||||||||||||||||||||||||||||||
| 23.1 | X | |||||||||||||||||||||||||||||||
| 31.1 | X | |||||||||||||||||||||||||||||||
| 31.2 | X | |||||||||||||||||||||||||||||||
| 32.1 | X | |||||||||||||||||||||||||||||||
| **101.INS | XBRL Instance Document | X | ||||||||||||||||||||||||||||||
| **101.SCH | XBRL Taxonomy Extension Schema Document | X | ||||||||||||||||||||||||||||||
| **101.CAL | XBRL Taxonomy Calculation Linkbase Document | X | ||||||||||||||||||||||||||||||
| **101.DEF | XBRL Taxonomy Definition Linkbase Document | X | ||||||||||||||||||||||||||||||
| **101.LAB | XBRL Taxonomy Label Linkbase Document | X | ||||||||||||||||||||||||||||||
| **101.PRE | XBRL Taxonomy Presentation Linkbase Document | X | ||||||||||||||||||||||||||||||
______________________________________
| # | Management contract or compensatory plan identified pursuant to Item 15(a)3. | |||||||
| * | Effective date of Form S-1. | |||||||
| ** | Pursuant to Rule 406T of Regulation S-T, XBRL (Extensible Business Reporting Language) information is deemed not filed or a part of a registration statement or prospectus for purposes of sections 11 or 12 of the Securities Act of 1933, is deemed not filed for purposes of section 18 of the Securities Exchange Act of 1934 and otherwise is not subject to liability under these sections. | |||||||
89
SIGNATURES
Pursuant to the requirements of Section 13 or 15(d) of the Securities Exchange Act of 1934, the registrant has duly caused this report to be signed on its behalf by the undersigned, thereunto duly authorized.
AVID TECHNOLOGY, INC.
(Registrant)
| By: | /s/ Jeff Rosica | ||||
| Jeff Rosica President and Chief Executive Officer (Principal Executive Officer) | |||||
| Date: | March 1, 2023 | ||||
Pursuant to the requirements of the Securities Exchange Act of 1934, this report has been signed below by the following persons on behalf of the registrant and in the capacities and on the dates indicated.
| By: | /s/ Jeff Rosica | By: | /s/ Kenneth Gayron | By: | /s/ Mariesa Victoria | |||||||||||||||||||||
| Jeff Rosica President and Chief Executive Officer (Principal Executive Officer) | Kenneth Gayron Executive Vice President and Chief Financial Officer (Principal Financial Officer) | Mariesa Victoria Vice President and Chief Accounting Officer (Principal Accounting Officer) | ||||||||||||||||||||||||
| Date: | March 1, 2023 | Date: | March 1, 2023 | Date: | March 1, 2023 | |||||||||||||||||||||
90
Pursuant to the requirements of the Securities Exchange Act of 1934, this report has been signed below by the following persons on behalf of the registrant and in the capacities and on the dates indicated.
NAME | TITLE | DATE | ||||||||||||
| /s/ John P. Wallace | ||||||||||||||
| John P. Wallace | Chairman of the Board of Directors | March 1, 2023 | ||||||||||||
| /s/ Jeff Rosica | ||||||||||||||
| Jeff Rosica | President and Chief Executive Officer | March 1, 2023 | ||||||||||||
| /s/ Christian A. Asmar | ||||||||||||||
| Christian A. Asmar | Director | March 1, 2023 | ||||||||||||
| /s/ Robert M. Bakish | ||||||||||||||
| Robert M. Bakish | Director | March 1, 2023 | ||||||||||||
| /s/ Paula E. Boggs | ||||||||||||||
| Paula E. Boggs | Director | March 1, 2023 | ||||||||||||
| /s/ Elizabeth M. Daley | ||||||||||||||
| Elizabeth M. Daley | Director | March 1, 2023 | ||||||||||||
| /s/ Nancy Hawthorne | ||||||||||||||
| Nancy Hawthorne | Director | March 1, 2023 | ||||||||||||
| /s/ Daniel B. Silvers | ||||||||||||||
| Daniel B. Silvers | Director | March 1, 2023 | ||||||||||||
| /s/ Peter Westley | ||||||||||||||
| Peter Westley | Director | March 1, 2023 | ||||||||||||
91
EXHIBIT 21
SUBSIDIARIES OF THE REGISTRANT AS OF DECEMBER 31, 2022
AVID SYSTEMS, INC. (California)
AVID CV LLC (Delaware)
AVID TECHNOLOGY WORLDWIDE, INC. (Delaware)
AVID TECHNOLOGY (AUSTRALIA) PTY LTD (Australia)
AVID TECHNOLOGY CANADA CORP. (Canada)
AVID TECHNOLOGY (BEIJING) CO., LTD (China)
AVID TECHNOLOGY EUROPE LIMITED (England)
INTEGRATED BROADCAST SERVICES LIMITED (IBIS) (England)
IVSM LIMITED (England)
AVID TECHNOLOGY S.A.R.L. (France)
AVID TECHNOLOGY GMBH (Germany)
AVID TECHNOLOGY HOLDING GMBH (Germany)
AVID NORTH ASIA LIMITED (Hong Kong)
AVID TECHNOLOGY (INDIA) PRIVATE LIMITED (India)
JIM LTD. (Israel)
ORAD HI-TEC SYSTEMS LTD. (Israel)
ORADNET LTD. (Israel)
AVID TECHNOLOGY K.K. (Japan)
AVID TECHNOLOGY MEXICO, S. DE R.L. DE C.V. (Mexico)
AVID GENERAL PARTNER B.V. (Netherlands)
AVID TECHNOLOGY C.V. (Netherlands)
AVID TECHNOLOGY HOLDING B.V. (Netherlands)
AVID TECHNOLOGY INTERNATIONAL B.V. (Netherlands)
ORAD NETHERLANDS B.V. (Netherlands)
AVID TECHNOLOGY POLAND SP. Z.O.O (Poland)
AVID TECHNOLOGY (S.E. ASIA) PTE LTD (Singapore)
AVID TECHNOLOGY S.L. (Spain)
ORAD HI-TEC SYSTEMS IBERIA SL (Spain)
AVID NORDIC A.B. (Sweden)
AVID TECHNOLOGY SERVICES TAIWAN CO., LTD (Taiwan)
EXHIBIT 23.1
CONSENT OF INDEPENDENT REGISTERED PUBLIC ACCOUNTING FIRM
Avid Technology, Inc.
Burlington, Massachusetts
We hereby consent to the incorporation by reference in the Registration Statements on Form S-8 (Nos. 333-42569, 333-56631, 333-60181, 333-73321, 333-87539, 333-33674, 333-37952, 333-48338, 333-48340, 333-64016, 333-75470, 333-151202, 333-200139, 333-218677, 333-225279, 333-238610, 333-256257, 333-265831) of Avid Technology, Inc. of our reports dated March 1, 2023, relating to the consolidated financial statements and the effectiveness of Avid Technology, Inc.’s internal control over financial reporting, which appear in this Annual Report on Form 10-K.
/s/ BDO USA, LLP
Boston, Massachusetts
March 1, 2023
EXHIBIT 31.1
CERTIFICATION
I, Jeff Rosica, certify that:
1.I have reviewed this Annual Report on Form 10-K of Avid Technology, Inc.;
2.Based on my knowledge, this report does not contain any untrue statement of a material fact or omit to state a material fact necessary to make the statements made, in light of the circumstances under which such statements were made, not misleading with respect to the period covered by this report;
3.Based on my knowledge, the financial statements, and other financial information included in this report, fairly present in all material respects the financial condition, results of operations and cash flows of the registrant as of, and for, the periods presented in this report;
4.The registrant's other certifying officer and I are responsible for establishing and maintaining disclosure controls and procedures (as defined in Exchange Act Rules 13a-15(e) and 15d-15(e)) and internal control over financial reporting (as defined in Exchange Act Rules 13a-15(f) and 15d-15(f)) for the registrant and have:
a)Designed such disclosure controls and procedures, or caused such disclosure controls and procedures to be designed under our supervision, to ensure that material information relating to the registrant, including its consolidated subsidiaries, is made known to us by others within those entities, particularly during the period in which this report is being prepared;
b)Designed such internal control over financial reporting, or caused such internal control over financial reporting to be designed under our supervision, to provide reasonable assurance regarding the reliability of financial reporting and the preparation of financial statements for external purposes in accordance with generally accepted accounting principles;
c)Evaluated the effectiveness of the registrant's disclosure controls and procedures and presented in this report our conclusions about the effectiveness of the disclosure controls and procedures, as of the end of the period covered by this report based on such evaluation; and
d)Disclosed in this report any change in the registrant's internal control over financial reporting that occurred during the registrant's most recent fiscal quarter (the registrant's fourth fiscal quarter in the case of an annual report) that has materially affected, or is reasonably likely to materially affect, the registrant's internal control over financial reporting; and
5.The registrant's other certifying officer and I have disclosed, based on our most recent evaluation of internal control over financial reporting, to the registrant's auditors and the audit committee of the registrant's board of directors (or persons performing the equivalent functions):
a)All significant deficiencies and material weaknesses in the design or operation of internal control over financial reporting which are reasonably likely to adversely affect the registrant's ability to record, process, summarize and report financial information; and
b)Any fraud, whether or not material, that involves management or other employees who have a significant role in the registrant's internal control over financial reporting.
| Date: | March 1, 2023 | /s/ Jeff Rosica | |||||||||||||||
| Jeff Rosica | |||||||||||||||||
President and Chief Executive Officer (Principal Executive Officer) | |||||||||||||||||
EXHIBIT 31.2
CERTIFICATION
I, Kenneth Gayron, certify that:
1.I have reviewed this Annual Report on Form 10-K of Avid Technology, Inc.;
2.Based on my knowledge, this report does not contain any untrue statement of a material fact or omit to state a material fact necessary to make the statements made, in light of the circumstances under which such statements were made, not misleading with respect to the period covered by this report;
3.Based on my knowledge, the financial statements, and other financial information included in this report, fairly present in all material respects the financial condition, results of operations and cash flows of the registrant as of, and for, the periods presented in this report;
4.The registrant's other certifying officer and I are responsible for establishing and maintaining disclosure controls and procedures (as defined in Exchange Act Rules 13a-15(e) and 15d-15(e)) and internal control over financial reporting (as defined in Exchange Act Rules 13a-15(f) and 15d-15(f)) for the registrant and have:
a)Designed such disclosure controls and procedures, or caused such disclosure controls and procedures to be designed under our supervision, to ensure that material information relating to the registrant, including its consolidated subsidiaries, is made known to us by others within those entities, particularly during the period in which this report is being prepared;
b)Designed such internal control over financial reporting, or caused such internal control over financial reporting to be designed under our supervision, to provide reasonable assurance regarding the reliability of financial reporting and the preparation of financial statements for external purposes in accordance with generally accepted accounting principles;
c)Evaluated the effectiveness of the registrant's disclosure controls and procedures and presented in this report our conclusions about the effectiveness of the disclosure controls and procedures, as of the end of the period covered by this report based on such evaluation; and
d)Disclosed in this report any change in the registrant's internal control over financial reporting that occurred during the registrant's most recent fiscal quarter (the registrant's fourth fiscal quarter in the case of an annual report) that has materially affected, or is reasonably likely to materially affect, the registrant's internal control over financial reporting; and
5.The registrant's other certifying officer and I have disclosed, based on our most recent evaluation of internal control over financial reporting, to the registrant's auditors and the audit committee of the registrant's board of directors (or persons performing the equivalent functions):
a)All significant deficiencies and material weaknesses in the design or operation of internal control over financial reporting which are reasonably likely to adversely affect the registrant's ability to record, process, summarize and report financial information; and
b)Any fraud, whether or not material, that involves management or other employees who have a significant role in the registrant's internal control over financial reporting.
| Date: | March 1, 2023 | /s/ Kenneth Gayron | |||||||||||||||
| Kenneth Gayron | |||||||||||||||||
| Executive Vice President and Chief Financial Officer | |||||||||||||||||
| (Principal Financial Officer) | |||||||||||||||||
EXHIBIT 32.1
CERTIFICATION PURSUANT TO 18 U.S.C. SECTION 1350,
AS ADOPTED PURSUANT TO
SECTION 906 OF THE SARBANES-OXLEY ACT OF 2002
In connection with the Annual Report on Form 10-K of Avid Technology, Inc. (the “Company”) for the year ended December 31, 2022 as filed with the Securities and Exchange Commission on the date hereof (the “Report”), the undersigned, Jeff Rosica, President and Chief Executive Officer of the Company, and Kenneth Gayron, Executive Vice President and Chief Financial Officer of the Company, each hereby certifies, pursuant to 18 U.S.C. Section 1350, that:
(1) The Report fully complies with the requirements of Section 13(a) or 15(d) of the Securities Exchange Act of 1934; and
(2) The information contained in the Report fairly presents, in all material respects, the financial condition and results of operations of the Company.
| Date: | March 1, 2023 | /s/ Jeff Rosica | ||||||||||||
| Jeff Rosica | ||||||||||||||
| President and Chief Executive Officer | ||||||||||||||
| (Principal Executive Officer) | ||||||||||||||
| Date: | March 1, 2023 | /s/ Kenneth Gayron | ||||||||||||
| Kenneth Gayron | ||||||||||||||
| Executive Vice President and Chief Financial Officer | ||||||||||||||
| (Principal Financial Officer) | ||||||||||||||
A certification furnished pursuant to this item will not be deemed “filed” for purposes of Section 18 of the Exchange Act (15 U.S.C. 78r), or otherwise subject to the liability of that section. Such certification will not be deemed to be incorporated by reference into any filing under the Securities Act or the Exchange Act, except to the extent that the registrant specifically incorporates it by reference.